


HA Sustainable Infrastructure Capital (HASI) has drawn fresh attention after a recent name change from Hannon Armstrong Sustainable Infrastructure Capital. The change has sharpened investor focus on its role in financing clean energy and broader climate-focused assets.
Recent trading has been choppy. The share price has eased over the past week and month, yet HA Sustainable Infrastructure Capital still carries a 90 day share price return of 2.87%, a year to date share price gain of 20.68%, and a 1 year total shareholder return of 45.36%. This suggests that short term caution follows a much stronger recent run, despite a weaker 5 year total shareholder return of 10.40%.
Position your clean energy thesis around a broader peer set by scanning hand picked issuers financing climate and grid projects across our 39 power grid technology and infrastructure stocks.HA Sustainable Infrastructure Capital has cooled off after a strong 1 year run of 45.36% and a weaker 5 year record. Is that a second chance to get in, or a reason to wait for a cheaper entry before running the numbers?
Preferred P/E of 58.5x: Is it justified?
Valuation is where HA Sustainable Infrastructure Capital divides opinion. The shares last closed at $38.40, yet the stock trades on a P/E ratio of 58.5x, which is far above both its own estimated fair P/E and the wider Diversified Financials peer group.
The P/E multiple reflects how much investors are paying today for each dollar of current earnings. For a lender and investor focused on sustainable infrastructure projects, a higher P/E often signals that the market is placing a premium on expected future earnings growth from its portfolio of energy efficiency, grid connected renewables, and emissions reducing assets.
In HA Sustainable Infrastructure Capital's case, that premium is steep. The company is described as expensive versus an estimated fair P/E of 17.5x, and it also screens as expensive against a peer average P/E of 7.1x and an industry average P/E of 17.2x. Those gaps suggest the current price builds in much stronger profit growth and project returns than the broader diversified financial sector, and the fair ratio highlights a level the valuation could move toward if expectations change.
For investors comparing earnings based valuations across similar businesses, the SWS fair ratio framework can help clarify whether that 58.5x multiple is stretching the fundamentals or simply reflecting a different risk and growth profile. Explore the SWS fair ratio for HA Sustainable Infrastructure Capital
Result: Price-to-earnings of 58.5x (OVERVALUED)
Still, the story around HA Sustainable Infrastructure Capital can quickly change if project level returns disappoint or if funding costs climb and squeeze earnings.
Find out about the key risks to this HA Sustainable Infrastructure Capital narrative.
Another view on HA Sustainable Infrastructure Capital's value
The earnings multiple paints HA Sustainable Infrastructure Capital as expensive, yet the SWS DCF model points in the opposite direction. At $38.40, the shares are described as trading about 25% below an estimated future cash flow value of $51.22. Does that gap flag mispricing or just optimistic cash flow assumptions?
For readers who want to see how that future cash flow estimate is built line by line, the SWS DCF model can be a useful cross check on the P/E story. Look into how the SWS DCF model arrives at its fair value.
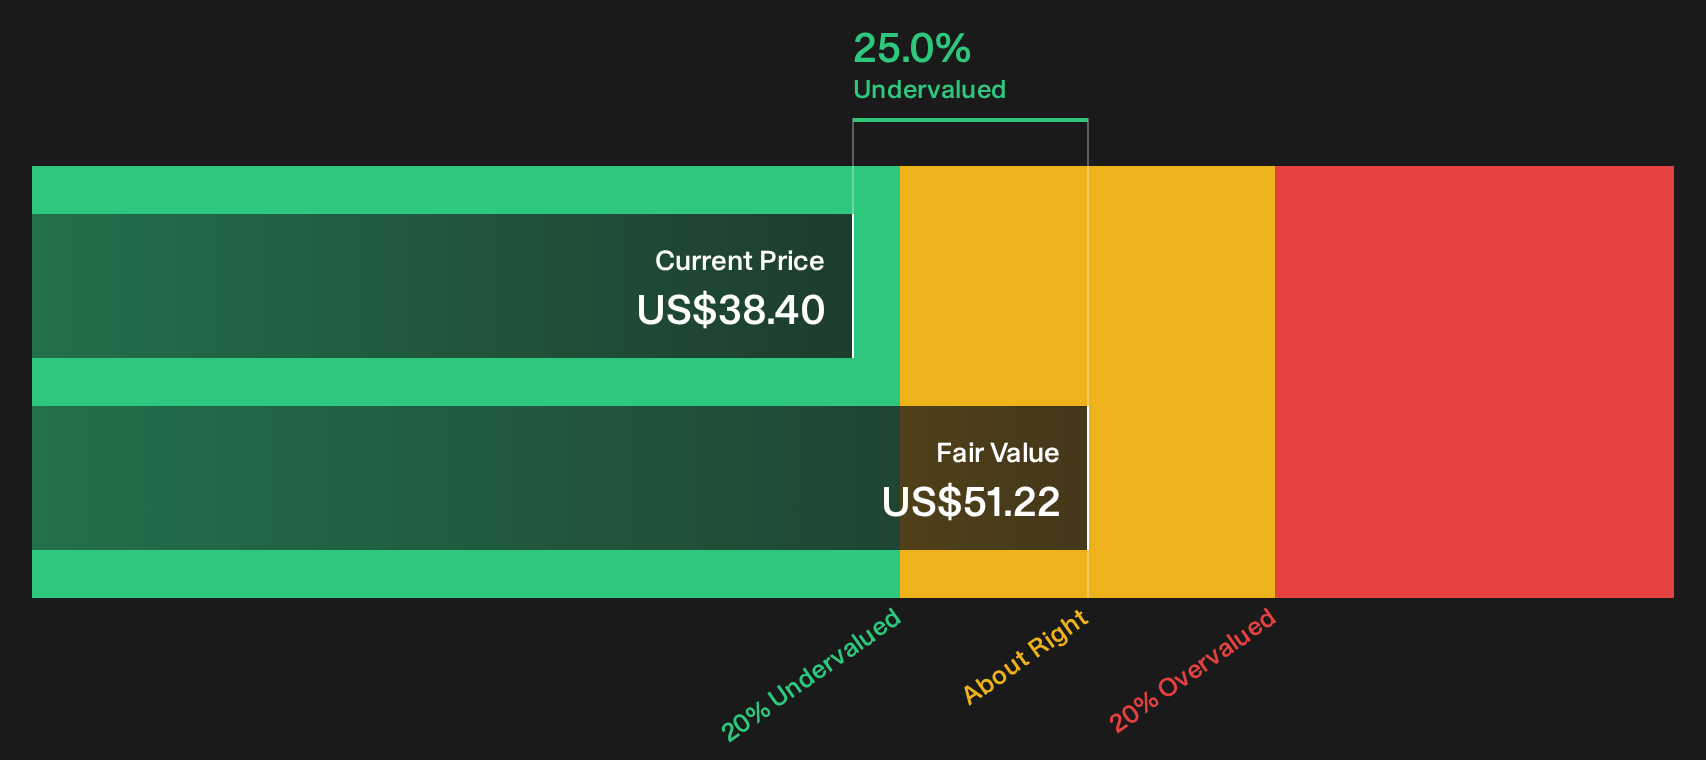
Simply Wall St performs a discounted cash flow (DCF) on every stock in the world every day (check out HA Sustainable Infrastructure Capital for example). We show the entire calculation in full. You can track the result in your watchlist or portfolio and be alerted when this changes, or use our stock screener to discover 31 high quality undervalued stocks. If you save a screener we even alert you when new companies match - so you never miss a potential opportunity.
Next Steps
Sentiment around HA Sustainable Infrastructure Capital is mixed, which is exactly why independent research matters. Move quickly, review both the concerns and the upside, then weigh the 3 key rewards and 3 important warning signs.
Looking for more HA Sustainable Infrastructure Capital investment ideas?
Do not park all your attention on HA Sustainable Infrastructure Capital alone. Broader watchlists often surface opportunities that fit your risk profile better.
- Target quality at a discount by scanning companies that combine resilient balance sheets with attractive pricing through our 31 high quality undervalued stocks.
- Build a steadier income stream by reviewing businesses that feature durable payouts inside the 6 dividend fortresses.
- Tighten your risk controls by focusing on companies with stronger financial resilience using the 10 resilient stocks with low risk scores.
This article by Simply Wall St is general in nature. We provide commentary based on historical data and analyst forecasts only using an unbiased methodology and our articles are not intended to be financial advice. It does not constitute a recommendation to buy or sell any stock, and does not take account of your objectives, or your financial situation. We aim to bring you long-term focused analysis driven by fundamental data. Note that our analysis may not factor in the latest price-sensitive company announcements or qualitative material. Simply Wall St has no position in any stocks mentioned.
Have feedback on this article? Concerned about the content? Get in touch with us directly. Alternatively, email editorial-team@simplywallst.com