


Yamato Holdings (TSE:9064) has moved to shut down its domestic dedicated cargo aircraft operations with Japan Airlines after a board decision on 3 September 2026 put cost pressures front and center for investors.
Yamato Holdings’ recent decision comes after a mixed run for investors, with a 9.97% 90-day share price return contrasting with a year-to-date share price decline of 12.64% and a 1-year total shareholder return that has fallen 18.01%. This suggests that momentum has improved in the short term while longer-term returns remain under pressure.
Capitalize on the pressure Yamato Holdings is feeling on transport costs by reviewing a curated list of solid balance sheet and fundamentals (19 results) that may handle similar shocks with greater resilience.Yamato Holdings is cutting an expensive experiment in air freight just as long term shareholders are still under water. Does that cost reset leave enough upside in the valuation to justify fresh risk?
Preferred P/E of 47.1x for Yamato Holdings: Is it justified?
Yamato Holdings closed at ¥1,963 while trading on a P/E of 47.1x, which looks rich compared with both its own fair P/E estimate and logistics peers.
The P/E ratio compares the current share price to earnings per share. For a logistics group like Yamato Holdings, it effectively shows how much investors are paying today for each unit of current profit, and whether they expect a sharp earnings recovery or are accepting a low yield on those profits.
On the one hand, forecasts point to earnings growth of 28.3% per year, which is quicker than the wider JP market expectation of 8.6% annual profit growth. On the other hand, the current earnings picture is weak, with profit margins at 0.7%, lower than 2.4% a year earlier, and earnings declining by 18.1% per year over the past 5 years. Against that backdrop, a 47.1x P/E looks elevated compared with an estimated fair P/E of 27x. The market could eventually move towards that level if enthusiasm cools or profits do not meet expectations.
The comparison with peers is even starker. The same 47.1x P/E sits well above the JP Logistics industry average of 14.6x and above the peer average of 28.4x. That gap signals investors are currently paying a premium for Yamato Holdings compared with other logistics businesses facing their own cost and demand questions.
Explore the SWS fair ratio for Yamato Holdings
Result: Price-to-earnings of 47.1x (OVERVALUED)
Still, the air cargo retreat could expose Yamato Holdings to volume shifts in other segments, and any stumble in margin recovery would quickly challenge that premium valuation.
Find out about the key risks to this Yamato Holdings narrative.
Another View on Yamato Holdings’ Value
The P/E looks stretched, yet our DCF model tells a very different story. At ¥1,963, Yamato Holdings trades at roughly a 44.6% discount to an estimated future cash flow value of ¥3,540.98. If those cash flows arrive as forecast, is the real risk ignoring that gap?
For a closer look at how this cash flow view is built, and how sensitive it is to different inputs, take a moment to walk through the Look into how the SWS DCF model arrives at its fair value.
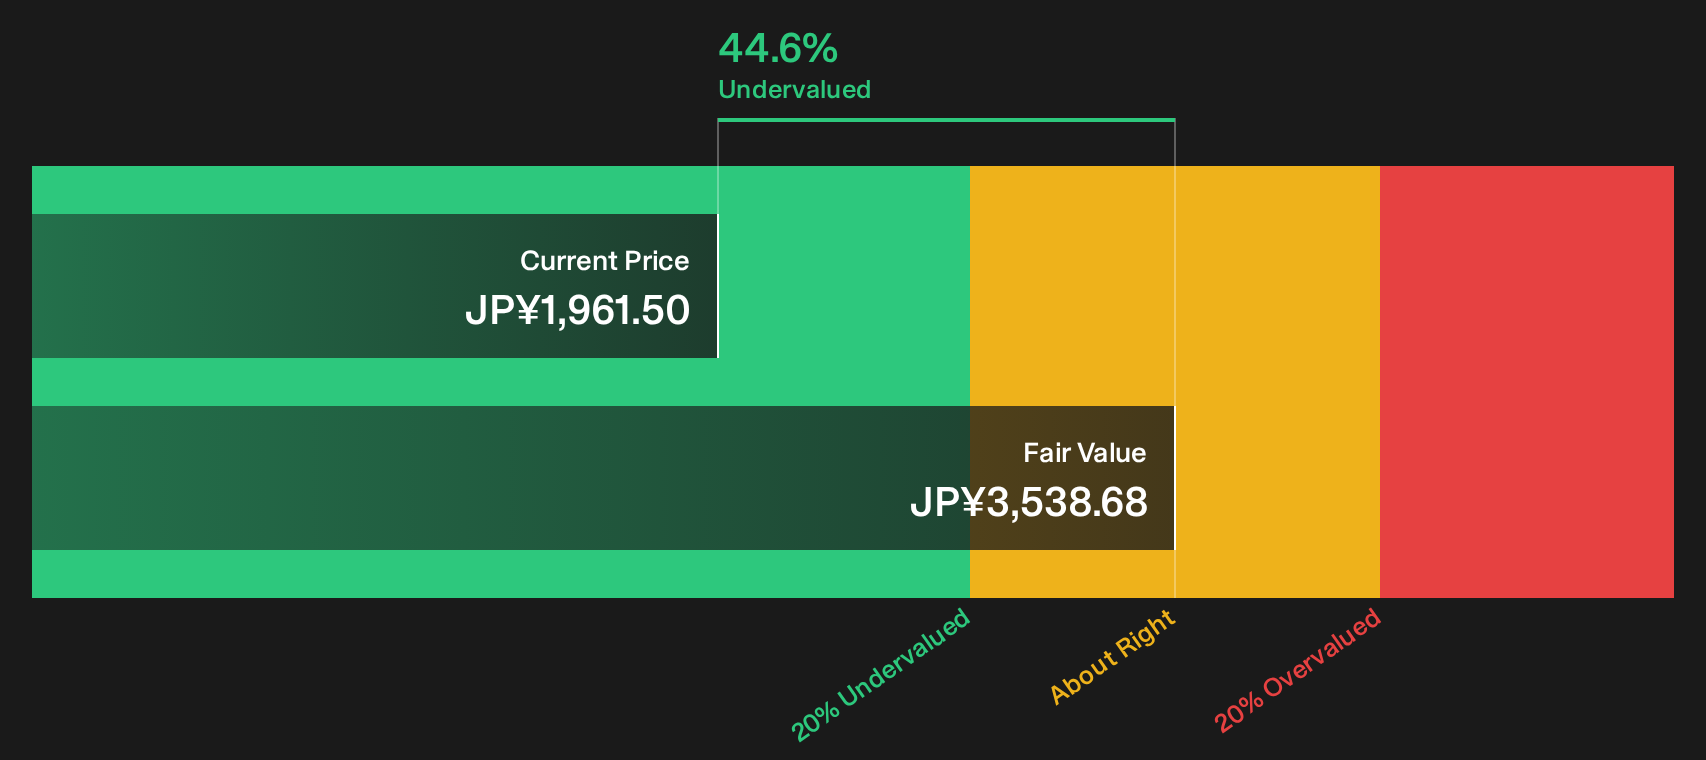
Simply Wall St performs a discounted cash flow (DCF) on every stock in the world every day (check out Yamato Holdings for example). We show the entire calculation in full. You can track the result in your watchlist or portfolio and be alerted when this changes, or use our stock screener to discover 17 high quality undervalued stocks. If you save a screener we even alert you when new companies match - so you never miss a potential opportunity.
Next Steps
Mixed signals around Yamato Holdings can be confusing, so review the figures yourself and act promptly to form your own view with the 2 key rewards and 3 important warning signs.
Looking for more ideas beyond Yamato Holdings?
If Yamato Holdings has your attention, you can use that focus to widen your opportunity set with data driven shortlists that highlight different types of potential setups.
- Target value by scanning a curated universe of companies trading on compelling fundamentals with the 17 high quality undervalued stocks.
- Prioritise resilience by reviewing the 10 resilient stocks with low risk scores for businesses that pair steadier profiles with measured risk scores.
- Get ahead of the crowd by checking the 73 high quality undiscovered gems before other investors start paying attention.
This article by Simply Wall St is general in nature. We provide commentary based on historical data and analyst forecasts only using an unbiased methodology and our articles are not intended to be financial advice. It does not constitute a recommendation to buy or sell any stock, and does not take account of your objectives, or your financial situation. We aim to bring you long-term focused analysis driven by fundamental data. Note that our analysis may not factor in the latest price-sensitive company announcements or qualitative material. Simply Wall St has no position in any stocks mentioned.
Have feedback on this article? Concerned about the content? Get in touch with us directly. Alternatively, email editorial-team@simplywallst.com