


MSA Safety (MSA) has put aviation maintenance back in focus with the A1X WinGrip vacuum anchor launch, a lighter and non electronic fall protection system aimed at a wider range of aircraft types.
MSA Safety shares have cooled in the short term, with the 1-day share price return declining 2.08% and the 30-day share price return down 4.31%. At the same time, a 15.87% 90-day share price return and 10.44% 1-year total shareholder return suggest momentum has been building alongside the strong Q2 results and the A1X WinGrip product rollout ahead of its MRO Europe showcase.
Scan beyond MSA Safety and see how other safety and industrial players are positioned by reviewing our curated list of list of solid balance sheet and fundamentals (24 results).
Recent gains in MSA Safety, despite a softer month, raise a simple question: Are investors reacting to stronger execution and product traction, or just chasing sentiment at current valuation levels?
Most Popular Narrative: 10.2% Undervalued
Against a last close of $184.80, the most followed narrative for MSA Safety pins fair value at $205.71, leaving a valuation gap that rests on specific growth and margin forecasts rather than sentiment alone.
Robust growth in connected safety solutions (such as MSA+ and ALTAIR io 4) reflects increasing customer adoption of advanced, cloud-connected worker technologies, a trend driven by heightened workplace safety requirements and industrial digitization. This positions MSA for above-average revenue and margin expansion as these premium products command higher prices.
Read the complete narrative. Read the complete narrative.
Want to see what is built into that fair value for MSA Safety. The narrative leans on steady top line progress, rising profitability, and a richer earnings multiple. Curious how those moving parts combine into a single number.
Result: Fair Value of $205.71 (UNDERVALUED)
Have a read of the narrative in full and understand what's behind the forecasts.
Still, the MSA Safety narrative can be tested quickly if margin pressures from tariffs and FX persist, or if core Fire Service demand remains soft.
Find out about the key risks to this MSA Safety narrative.
Another View on MSA Safety’s Valuation
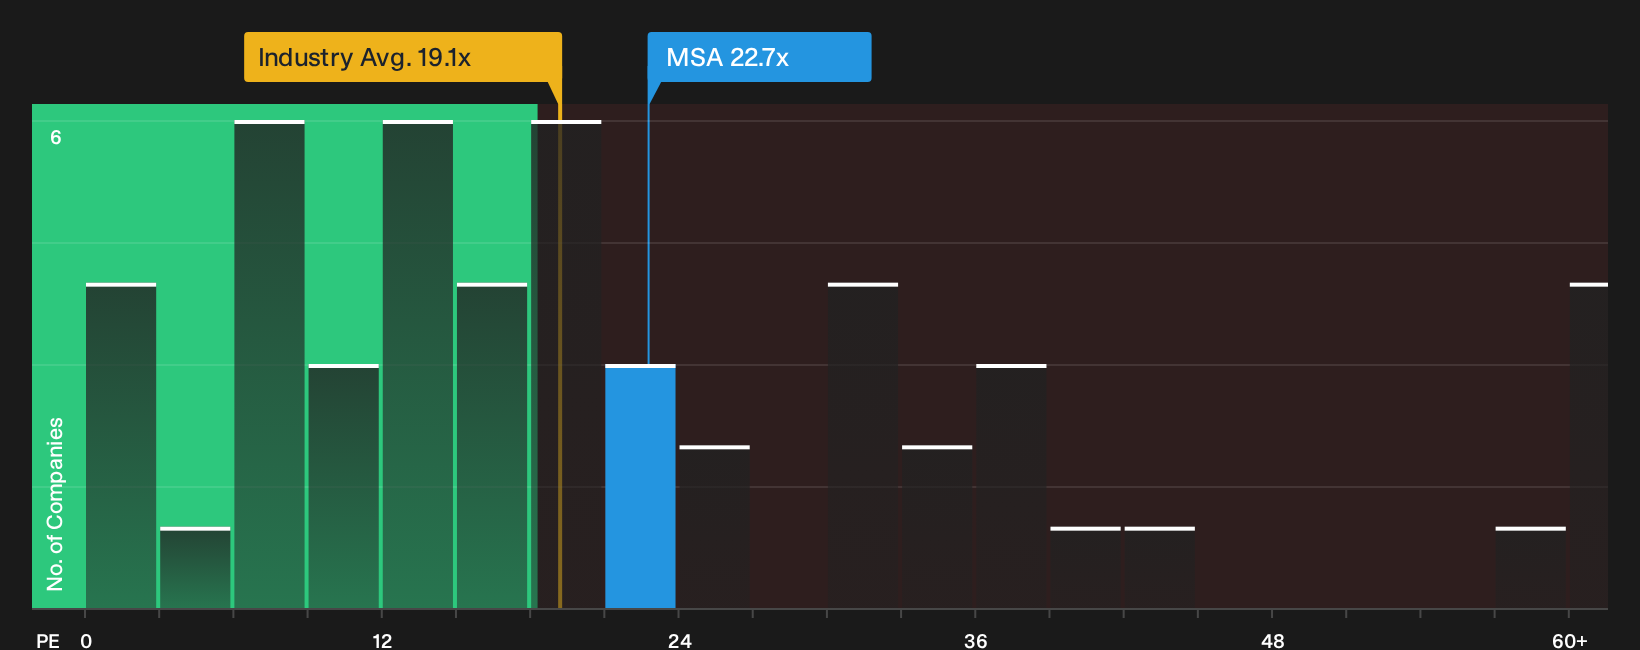
On the other side of that fair value story, MSA Safety screens as expensive on simple earnings math. The current P/E of 22.7x sits above the US Commercial Services industry at 19.4x, peers at 15.6x, and even the fair ratio of 19x. This points to less room for error if growth or margins disappoint.
That kind of premium can reflect quality, or it can just mean you are paying up for what is already in the price. The question is how comfortable you are with that trade off at $184.80.
See what the numbers say about this price — find out in our valuation breakdown.
Next Steps
Mixed messages around MSA Safety can make it hard to know what really matters. Consider reviewing the numbers yourself and weighing both the strengths and the weaker spots through the 3 key rewards and 1 important warning sign.
Looking for more investment ideas beyond MSA Safety?
If you only stick with what you already know, you risk missing companies that better match your goals, risk tolerance, and time horizon.
- Target potential mispricings by scanning a curated set of 31 high quality undervalued stocks that combine solid fundamentals with room for the market to reassess them.
- Strengthen your income stream by reviewing a focused group of 6 dividend fortresses that pair higher yields with more resilient payout histories.
- Dial back portfolio risk by assessing 10 resilient stocks with low risk scores that score well on financial stability and volatility, before the crowd catches on.
This article by Simply Wall St is general in nature. We provide commentary based on historical data and analyst forecasts only using an unbiased methodology and our articles are not intended to be financial advice. It does not constitute a recommendation to buy or sell any stock, and does not take account of your objectives, or your financial situation. We aim to bring you long-term focused analysis driven by fundamental data. Note that our analysis may not factor in the latest price-sensitive company announcements or qualitative material. Simply Wall St has no position in any stocks mentioned.
Have feedback on this article? Concerned about the content? Get in touch with us directly. Alternatively, email editorial-team@simplywallst.com