


LU-VE (BIT:LUVE) is back in focus after reporting half year 2026 earnings, with sales of €325.14 million and net income of €26.45 million compared with the prior year period.
LU-VE’s stronger half year figures have come alongside a sharp re-rating, with the share price up 63.2% year to date and recent gains accelerating. A 1 year total shareholder return of 91.87% suggests longer term holders have already seen substantial upside.
Scan other industrial players showing strong earnings momentum and recent re-ratings with our curated list of 619 high quality undiscovered gems to see how LU-VE compares within a wider opportunity set.
Bulls see LU-VE’s stronger half year figures and sharp 91.87% 1 year return as proof of a higher earnings base. Bears worry the 63.2% year to date surge already prices that in. Which side does the current valuation support?
Price-to-Earnings of 29.6x: Is it justified?
On a simple earnings lens, LU-VE trades on a P/E of 29.6x, which leaves the stock looking expensive next to both its peers and fair value benchmarks.
The P/E ratio compares the current share price with annual earnings per share. For a manufacturer of heat exchangers and cooling equipment like LU-VE, this measure captures how much investors are willing to pay for each euro of profit generated from its industrial operations.
LU-VE carries a P/E of 29.6x compared with a peer average of 23.6x and a broader European Building industry average of 24.2x. That represents a clear premium. Our fair P/E estimate of 20.7x implies a level the market could shift toward if expectations around future earnings ease from their current setting.
Explore the SWS fair ratio for LU-VE.
Result: Price-to-Earnings of 29.6x (OVERVALUED)
Still, LU-VE’s rerating could unwind if earnings growth slows from recent levels, or if the wider European building sector’s valuation multiples compress.
Find out about the key risks to this LU-VE narrative.
Another View on LU-VE’s €64.3 Share Price
The first check using the 29.6x P/E multiple paints LU-VE as expensive, yet the SWS DCF model points to a future cash flow value of €54.69 per share, which also leaves the stock looking rich. If both signals lean the same way, what exactly is the market paying up for?
Look into how the SWS DCF model arrives at its fair value.
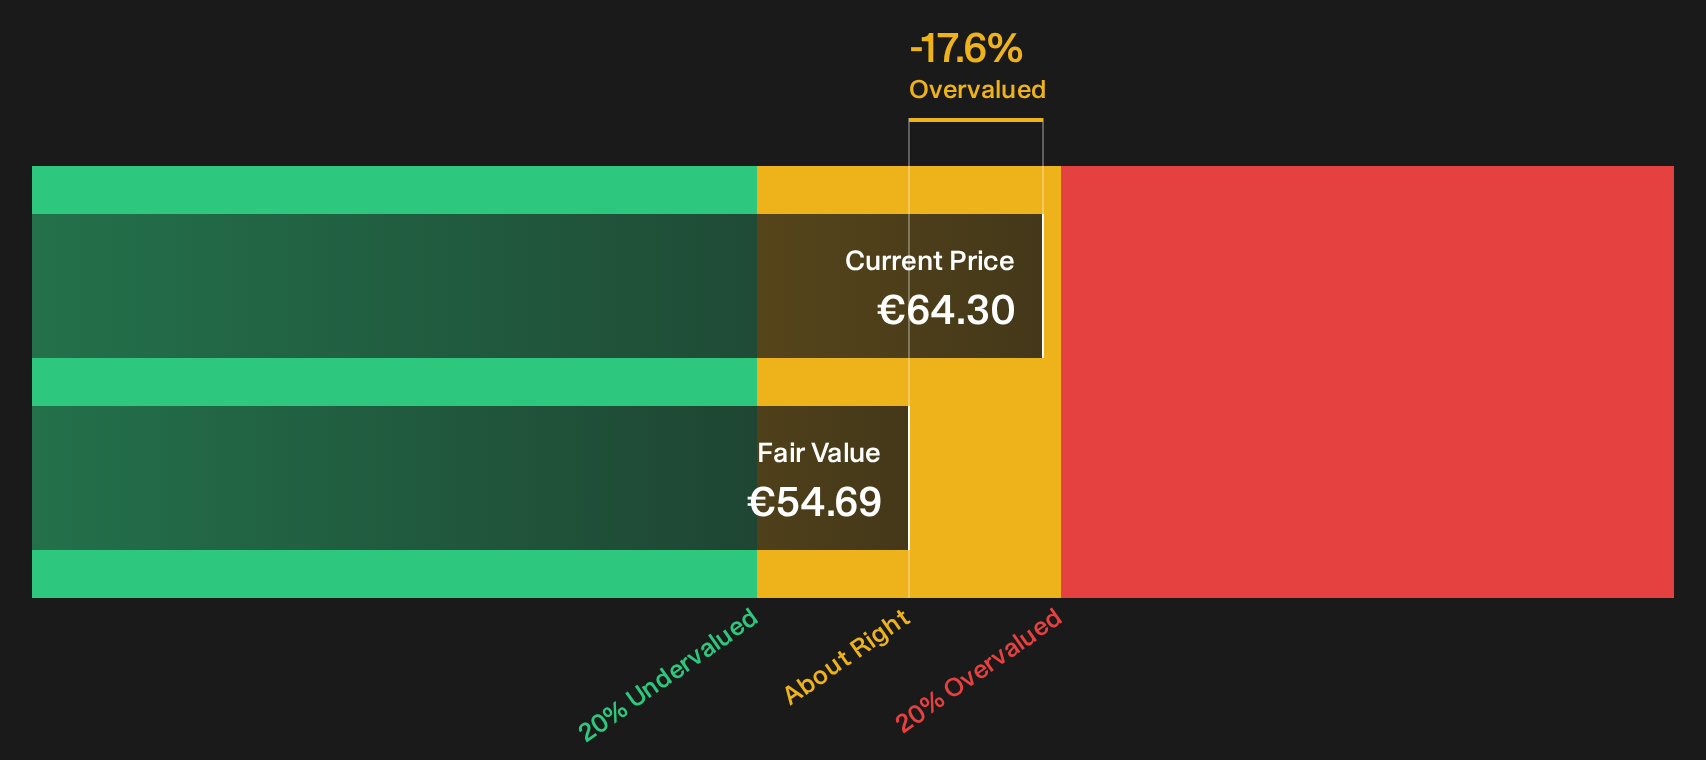
Simply Wall St performs a discounted cash flow (DCF) on every stock in the world every day (check out LU-VE for example). We show the entire calculation in full. You can track the result in your watchlist or portfolio and be alerted when this changes, or use our stock screener to discover 184 high quality undervalued stocks. If you save a screener we even alert you when new companies match - so you never miss a potential opportunity.
Next Steps
The mixed tone around LU-VE’s premium valuation and strong recent returns makes this a good moment to move fast and check the underlying data yourself, weighing both the upside potential and the concerns flagged in the 2 key rewards and 1 important warning sign.
Want more LU-VE style ideas to research next?
If LU-VE has sharpened your focus on valuation and quality, do not stop here. The next move you make could matter more than this one.
- Target resilient balance sheets and steady fundamentals by screening a list of solid balance sheet and fundamentals (193 results) that can handle tougher conditions without forcing you into rash decisions.
- Hunt for quality at a discount by filtering for 184 high quality undervalued stocks that pair solid cash flows with prices that have not yet caught up.
- Prioritise sleep-at-night stability by reviewing 99 resilient stocks with low risk scores that score well on financial strength and smaller downside flags.
This article by Simply Wall St is general in nature. We provide commentary based on historical data and analyst forecasts only using an unbiased methodology and our articles are not intended to be financial advice. It does not constitute a recommendation to buy or sell any stock, and does not take account of your objectives, or your financial situation. We aim to bring you long-term focused analysis driven by fundamental data. Note that our analysis may not factor in the latest price-sensitive company announcements or qualitative material. Simply Wall St has no position in any stocks mentioned.
Have feedback on this article? Concerned about the content? Get in touch with us directly. Alternatively, email editorial-team@simplywallst.com