


MarineMax (HZO) has drawn fresh attention after its share price hovered near US$52.20, with recent returns over the past 3 months and year putting the stock back on many boating retail watchlists.
MarineMax’s recent share price return has cooled in the very short term, yet the 90 day share price return of 53.53% and year to date share price return of 116.78% point to strong momentum, broadly echoed by a 1 year total shareholder return of 95.58%.
Scan beyond MarineMax and see which retailers with resilient balance sheets and fundamentals are also showing strong share price momentum using our curated list of solid balance sheet and fundamentals (23 results).
MarineMax has already shifted sharply higher, and the share price now sits close to the latest analyst target. Is this a fair entry point, or does patience for a cheaper valuation make more sense?
Most Popular Narrative: 11.1% Overvalued
MarineMax is trading at $52.20 against a narrative fair value of $47.00, so the spotlight shifts to what assumptions are doing the heavy lifting.
The recovery of consumer confidence, ongoing wealth creation among high-net-worth individuals, and a resilient appetite for premium leisure experiences suggest that delayed purchases could convert to future sales as macroeconomic headwinds abate. This is likely to drive a rebound in revenue growth and support higher average selling prices.
Want to see what sits behind that confidence in MarineMax? The narrative leans on stronger margins, faster earnings growth, and a different profit profile than today. The key assumptions are specific and surprisingly ambitious. The full story is in how those moving parts link back to that $47.00 fair value.
Result: Fair Value of $47.00 (OVERVALUED)
Have a read of the narrative in full and understand what's behind the forecasts.
Still, MarineMax faces meaningful risks if elevated industry inventory keeps pricing pressure in place or if high boat prices keep buyers on the sidelines longer.
Find out about the key risks to this MarineMax narrative.
Another View: SWS DCF Model Points the Other Way
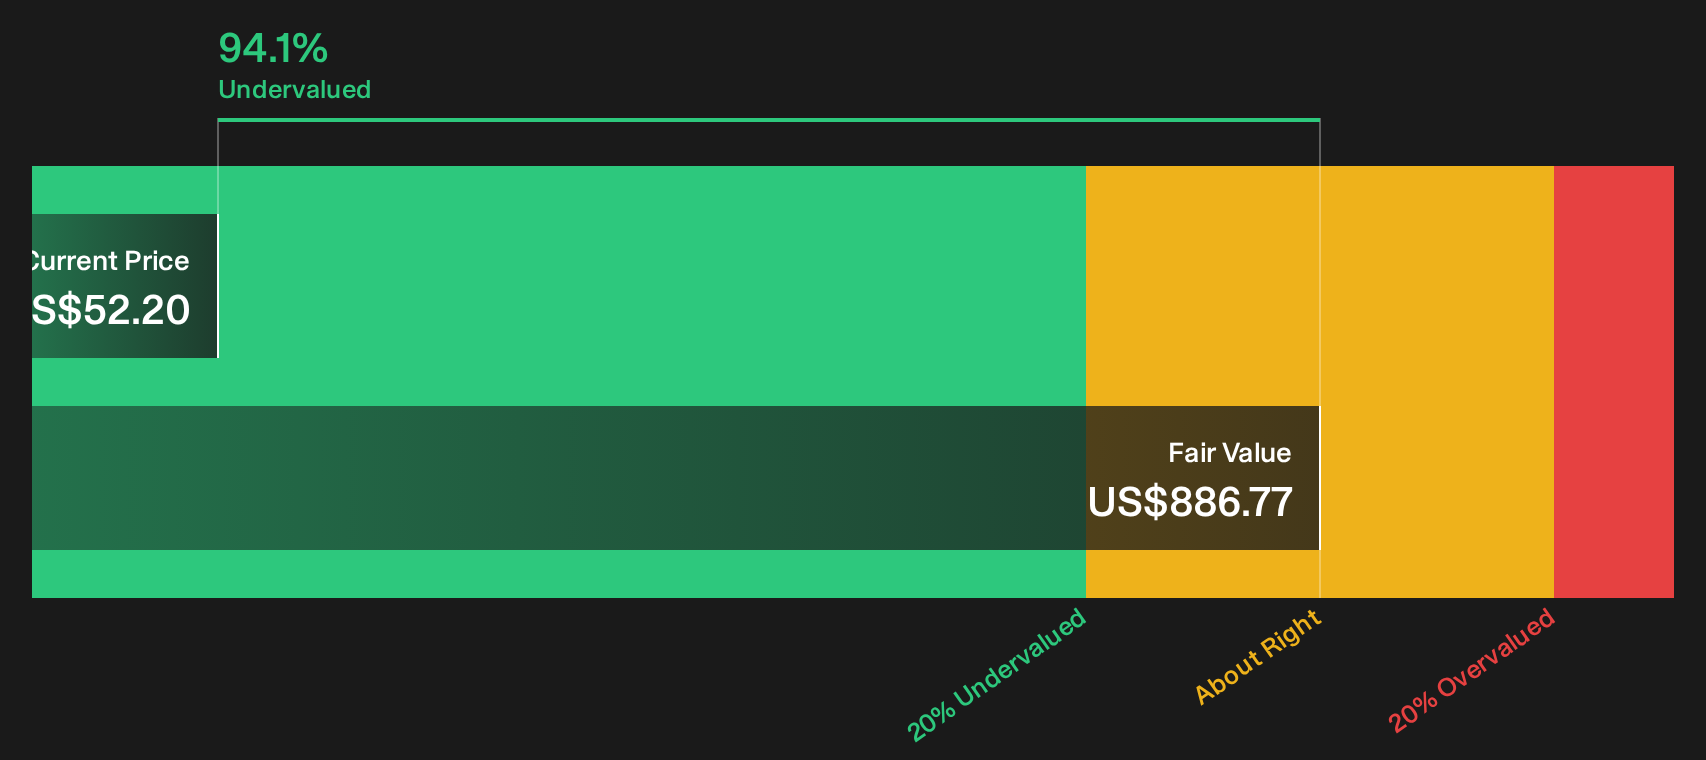
The narrative fair value pegs MarineMax at $47.00 and calls the stock 11.1% overvalued. The SWS DCF model tells a very different story. On that math, MarineMax at $52.20 is trading around 94.1% below an estimated future cash flow value of $886.77, which implies a very large upside gap investors need to rationalise.
The question is which lens you trust more for MarineMax at this stage: analyst earnings paths and multiples, or a cash flow curve that paints the current quote as deeply discounted.
Look into how the SWS DCF model arrives at its fair value.
Simply Wall St performs a discounted cash flow (DCF) on every stock in the world every day (check out MarineMax for example). We show the entire calculation in full. You can track the result in your watchlist or portfolio and be alerted when this changes, or use our stock screener to discover 33 high quality undervalued stocks. If you save a screener we even alert you when new companies match - so you never miss a potential opportunity.
Next Steps
Mixed signals around MarineMax can create a lot of noise, so act while the data is fresh and build your own view using the 3 key rewards and 3 important warning signs.
Looking for more MarineMax investment ideas?
Momentum in MarineMax can be a useful signal, but your next edge often comes from lining up a few fresh stock ideas side by side.
- Target higher quality opportunities by checking companies that screen as attractively priced with strong fundamentals through our curated 33 high quality undervalued stocks.
- Strengthen your income stream by reviewing businesses that combine resilient operations with generous yields using the focused 6 dividend fortresses.
- Dial down portfolio stress by scanning companies that carry robust financial footing and lower overall risk through the carefully filtered 11 resilient stocks with low risk scores.
This article by Simply Wall St is general in nature. We provide commentary based on historical data and analyst forecasts only using an unbiased methodology and our articles are not intended to be financial advice. It does not constitute a recommendation to buy or sell any stock, and does not take account of your objectives, or your financial situation. We aim to bring you long-term focused analysis driven by fundamental data. Note that our analysis may not factor in the latest price-sensitive company announcements or qualitative material. Simply Wall St has no position in any stocks mentioned.
Have feedback on this article? Concerned about the content? Get in touch with us directly. Alternatively, email editorial-team@simplywallst.com