


Matrix IT (TASE:MTRX) has drawn fresh attention after announcing a dividend of $0.33 per share, with management signaling that the current payout ratio aims to support ongoing shareholder distributions.
Recent trading has been mixed for Matrix IT, with the share price up 22.45% over the past 30 days and 28.04% over 90 days, yet still down 26.08% on a year to date share price basis and delivering a 1 year total shareholder return decline of 8.74%. However, the 3 year and 5 year total shareholder returns of 54.69% and 50.06% indicate that longer term holders have fared better, as the latest dividend news and an orderly CFO transition set for March 2027 reshape how investors weigh income against management change risk.
Scan how Matrix IT’s dividend move stacks up against other income opportunities by reviewing our hand picked list of 164 dividend fortresses.
Matrix IT now offers a fresh dividend alongside a share price that has rebounded sharply but still trails its recent history. Is it more reasonable to enter the position today, or to wait for a potentially cheaper entry point before the next move?
Price-to-Earnings of 26.7x: Is it justified?
On valuation, Matrix IT changes hands at a P/E of 26.7x, which places the stock on a richer earnings multiple than many peers, even after the recent share price recovery.
The P/E ratio compares the current share price with earnings per share and effectively tells you how many years of current profits the market is willing to pay for. For a services heavy IT group like Matrix IT, that figure often reflects expectations around contract visibility, margin resilience, and how repeatable those profits look over time.
Here, the data shows MTRX is expensive based on its P/E of 26.7x versus a peer average of 17.3x. It is also expensive against the broader Asian IT industry average of 18.6x. That gap suggests investors are currently paying a clear premium for each shekel of earnings compared with both its local peer group and the wider regional sector. This is a key consideration if you are weighing the new dividend against the price paid for those cash flows.
To see what the numbers say about this price, and how that premium multiple breaks down across earnings and cash flows, review our valuation breakdown in See what the numbers say about this price — find out in our valuation breakdown..
Result: Price-to-Earnings of 26.7x (OVERVALUED)
Still, the richer P/E and high reliance on Israel and a few core regions leave Matrix IT exposed if client budgets tighten or large contracts rotate away.
Find out about the key risks to this Matrix IT narrative.
Another View on Matrix IT’s Value
The P/E premium paints Matrix IT as expensive, yet the SWS DCF model goes further. At a share price of ₪106.3, it estimates future cash flow value at ₪48.65, which flags the stock as materially overvalued on that lens. Which signal should carry more weight in your process?
Look into how the SWS DCF model arrives at its fair value.
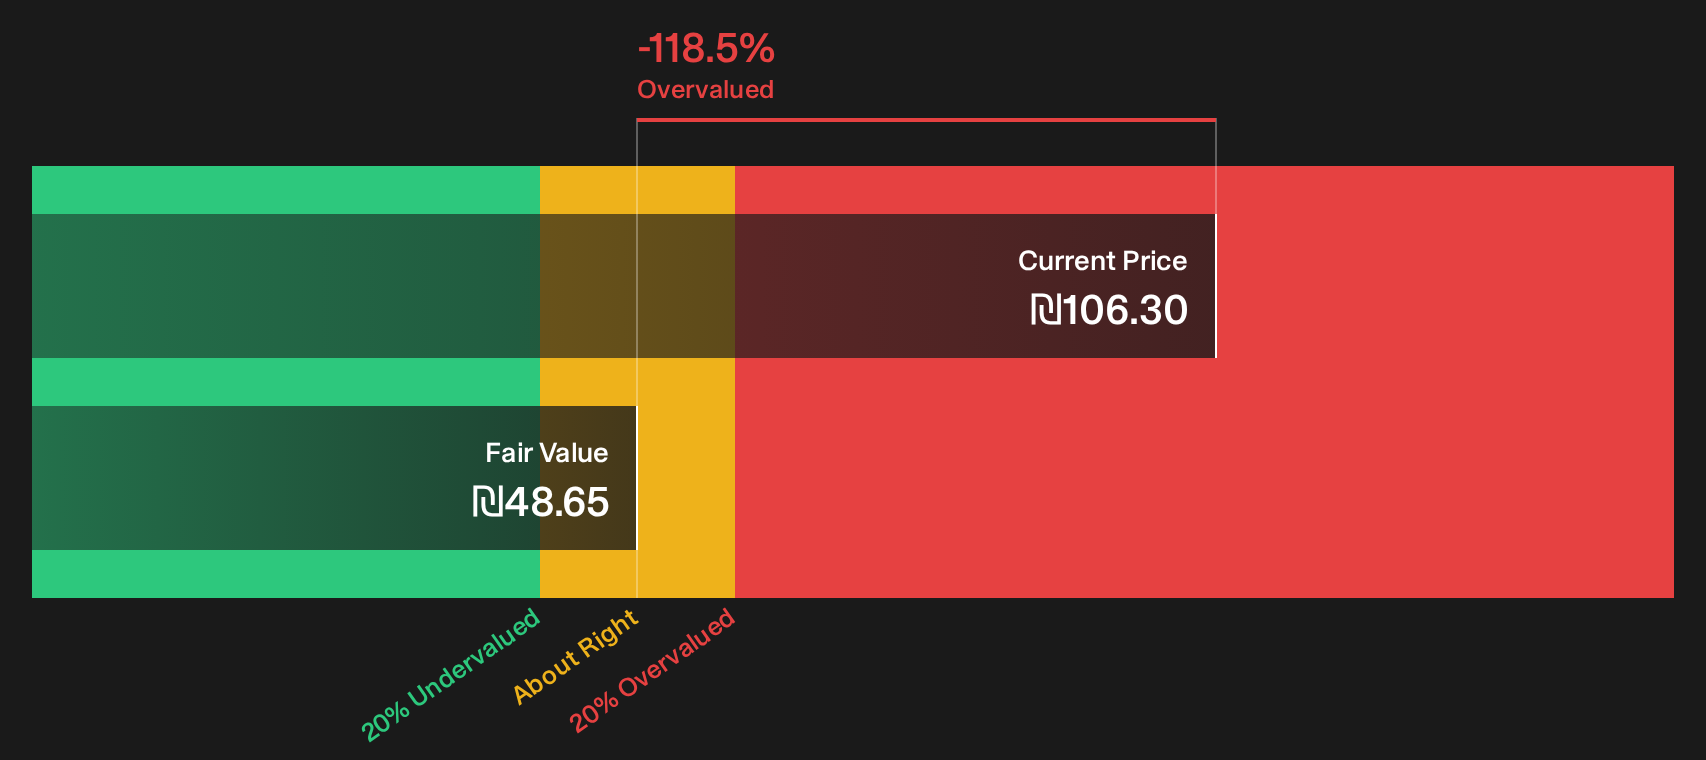
Simply Wall St performs a discounted cash flow (DCF) on every stock in the world every day (check out Matrix IT for example). We show the entire calculation in full. You can track the result in your watchlist or portfolio and be alerted when this changes, or use our stock screener to discover 184 high quality undervalued stocks. If you save a screener we even alert you when new companies match - so you never miss a potential opportunity.
Next Steps
Sentiment around Matrix IT is clearly mixed, with fresh income appeal on one side and valuation and execution questions on the other. Use the full data set, not just the headline metrics, to decide where you stand by reviewing the 2 key rewards and 1 important warning sign.
Looking for more Matrix IT investment ideas?
If Matrix IT has sharpened your focus on valuation and income, do not stop here. Fresh opportunities often sit just beyond the obvious tickers you already follow.
Use the Simply Wall Street Screener to scan for other opportunities before the crowd gets there.
- Target quality at a discount by checking companies that currently appear mispriced on fundamentals through our 184 high quality undervalued stocks.
- Strengthen your income stream by assessing businesses with resilient payouts using the 164 dividend fortresses.
- Reduce downside risk by focusing on financially robust tickers in the list of solid balance sheet and fundamentals (192 results).
This article by Simply Wall St is general in nature. We provide commentary based on historical data and analyst forecasts only using an unbiased methodology and our articles are not intended to be financial advice. It does not constitute a recommendation to buy or sell any stock, and does not take account of your objectives, or your financial situation. We aim to bring you long-term focused analysis driven by fundamental data. Note that our analysis may not factor in the latest price-sensitive company announcements or qualitative material. Simply Wall St has no position in any stocks mentioned.
Have feedback on this article? Concerned about the content? Get in touch with us directly. Alternatively, email editorial-team@simplywallst.com