


Traders have spent the past week edging away from SOL, with the stock down almost 5% over seven days, yet the fresh earnings tell a calmer story. The company just delivered about €963m in first half revenue and roughly €0.99 in basic earnings per share, while trailing earnings still support a P/E of 28.5x that sits close to its peer average. The real fault line is valuation. A discounted cash flow estimate of €25.33 against a €54.40 share price suggests emotion, not just chemistry fundamentals, is driving a big part of today’s reaction.
Love SOL's earnings delivery but uneasy about paying a premium P/E multiple over an internal value estimate that sits at less than half the current share price? Filter for stocks where fundamentals and valuation are more closely aligned with our 184 high quality undervalued stocks.
H1 2026 Earnings Summary
- Revenue (H1 2026 vs. H1 2025): €962.7m vs. €874.1m (higher year on year)
- Net Income (Excl. Extra Items, H1 2026 vs. H1 2025): €89.9m vs. €83.5m (higher year on year)
- Basic EPS (H1 2026 vs. H1 2025): €0.991 per share vs. €0.921 per share (higher year on year)
- Net Profit Margin (Trailing 12 Months vs. Prior Year): 9.2% vs. 9.0% (modest margin improvement)
Prefer clean visuals instead of another dense page of earnings tables and P/E ratios? See SOL's full financial picture, including a clear valuation snapshot against its current share price, in the company report for SOL.
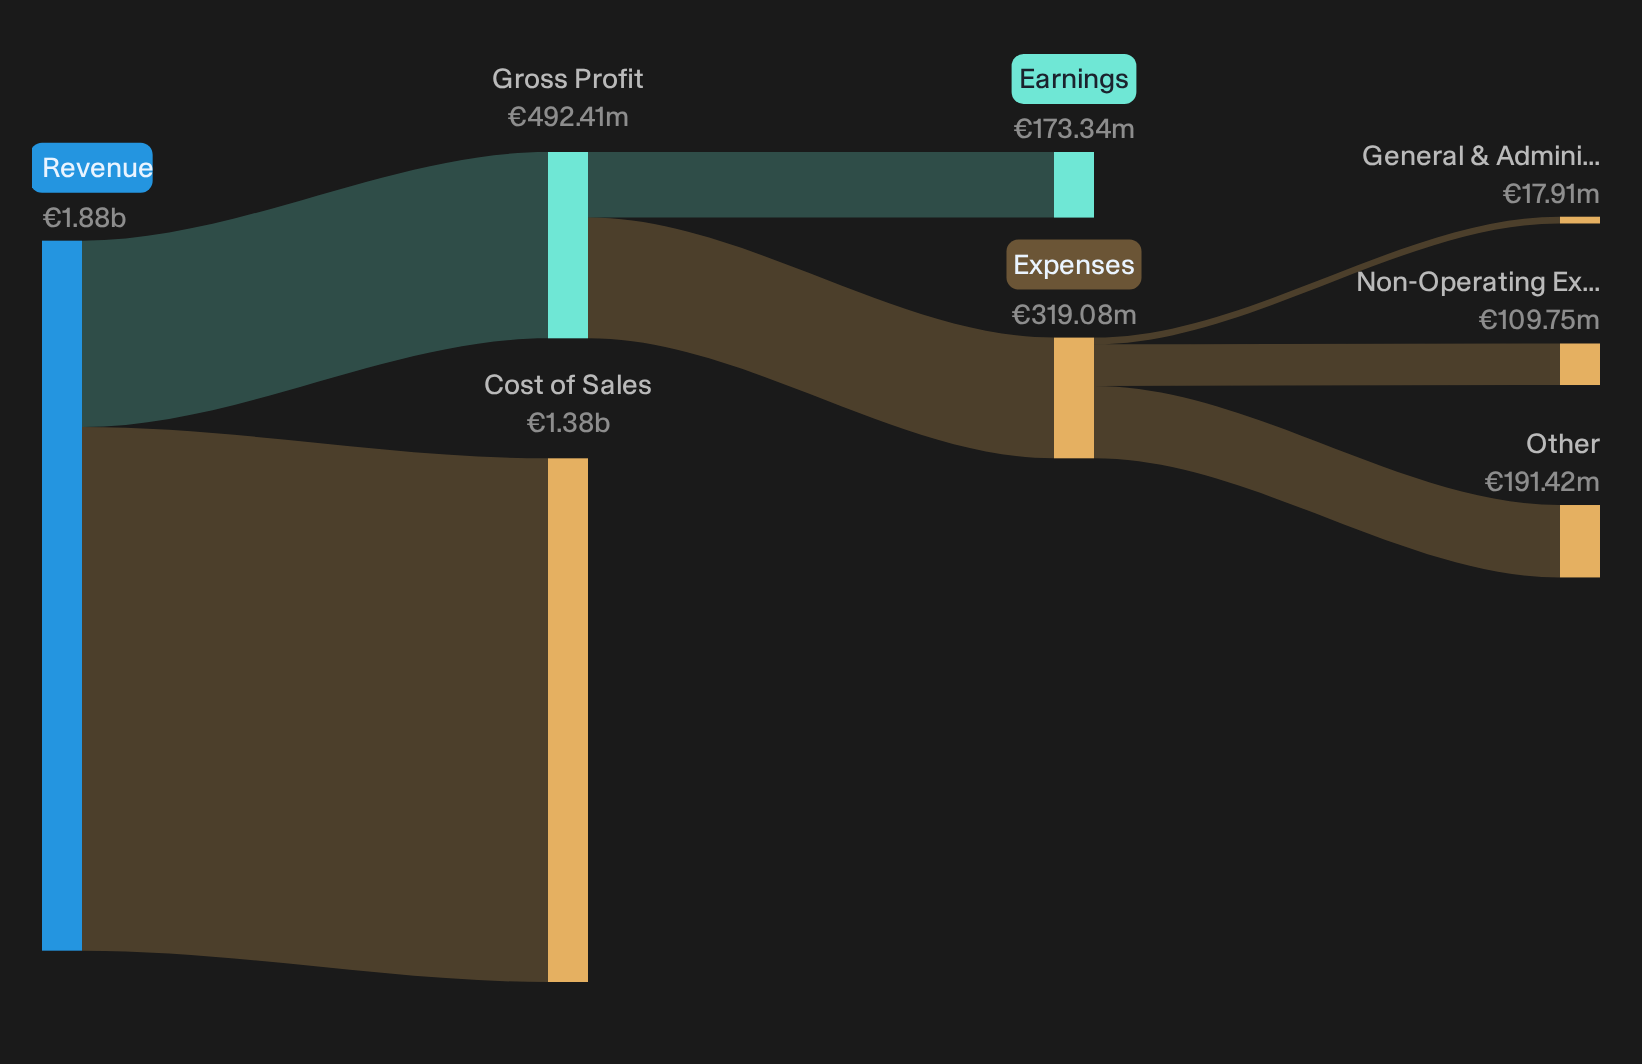
SOL earnings keep the defensive story intact
For anyone leaning bullish on SOL as a steady healthcare and industrial gases player, these results broadly back that view. Revenue in H1 2026 is above H1 2025, net income excluding extra items is higher, and basic EPS has improved. The trailing net margin has edged up to 9.2% from 9.0%. That pattern points to a business that is growing earnings rather than just holding the line. For a group often viewed as defensive, that combination of higher sales and slightly stronger profitability supports the idea of a resilient underlying model.
Valuation worries meet only mild profit pressure
Bearish voices will focus on the valuation gap to internal estimates and the recent share price slide over 7, 30 and 90 days. The latest income statement trends, though, do not show clear deterioration. Revenue, net income excluding extra items and EPS are all above the prior H1, while trailing margins have nudged higher instead of compressing. That does not remove longer term concerns about capital intensity or regulatory pressure in healthcare. It does suggest the immediate financial picture looks steadier than a sharply negative thesis would imply.
Compare SOL's steadier earnings pattern with the recent share price pullback and ask a simple question. Reveal whether analysts think that operational progress justifies the current €54.40 level by checking the consensus price target analysis for SOL.Stay Ahead Of Your Next Move
SOL's valuation gap against its internal estimate and recent share pullback make it a stock you may want to track closely, so register for free with Simply Wall St and add it to your Watchlist to watch how the share price lines up against fair value over time. After taking a position, keep control of your holdings with the Portfolio Command Center that cuts through noise and flags only the most important developments. For a broader perspective on SOL alongside other ideas, tap into the Community to see how different investors are thinking through the same data. By surfacing potential catalysts and risks early, Simply Wall St helps you act with confidence while staying a step ahead of the wider market.
Seeking Alternatives Beyond SOL?
Fresh ideas move fast. Some tickers build quiet momentum, others are dropping back to earth and a few are still under the radar for now. Act now.
- Spot sturdier balance sheets before momentum really builds by scanning the curated list of solid balance sheet and fundamentals stocks (192 results) and focus on businesses where financial footing does more of the heavy lifting.
- Chase early breakout potential in cash generative AI players with the hand picked 74 profitable AI stocks that aren't just burning cash while the crowd is still fixated on headline stories.
- Track critical power grid upgrades as money flows into infrastructure using the focused 39 power grid technology and infrastructure stocks and avoid being caught reacting after the sector is already flying.
This article by Simply Wall St is general in nature. We provide commentary based on historical data and analyst forecasts only using an unbiased methodology and our articles are not intended to be financial advice. It does not constitute a recommendation to buy or sell any stock, and does not take account of your objectives, or your financial situation. We aim to bring you long-term focused analysis driven by fundamental data. Note that our analysis may not factor in the latest price-sensitive company announcements or qualitative material. Simply Wall St has no position in any stocks mentioned.
Have feedback on this article? Concerned about the content? Get in touch with us directly. Alternatively, email editorial-team@simplywallst.com