


BOK Financial stock has delivered an 80.5% total return over the past five years, yet its current valuation signals pull in different directions, with an Excess Returns intrinsic value estimate suggesting the shares may trade below fair value while market multiples point the other way.
- The 80.5% return over five years highlights that long term holders have already seen substantial gains, so fresh buyers need to think carefully about what is priced in today.
- Expectations for steady lending and fee income can support the valuation, while any deterioration in credit quality or funding costs may quickly pressure what investors are willing to pay.
- BOK Financial screens as undervalued in 2 of 6 checks, which leans more expensive than cheap on the broader review of its valuation value score of 2.
The issue now is whether BOK Financial's recent share price level around US$135 fairly reflects its intrinsic value or leans too rich given the mixed signals.
Compare BOK Financial's mixed valuation signals with a curated list of other banks and financials screened as 33 high quality undervalued stocks to see where the market might be overlooking similar setups.
Does BOK Financial Look Undervalued on Excess Returns?
The Excess Returns model evaluates how much profit BOK Financial can earn on shareholder equity above its estimated cost of capital. In this framework, the key question is whether those surplus returns justify a share price above the current market quote.
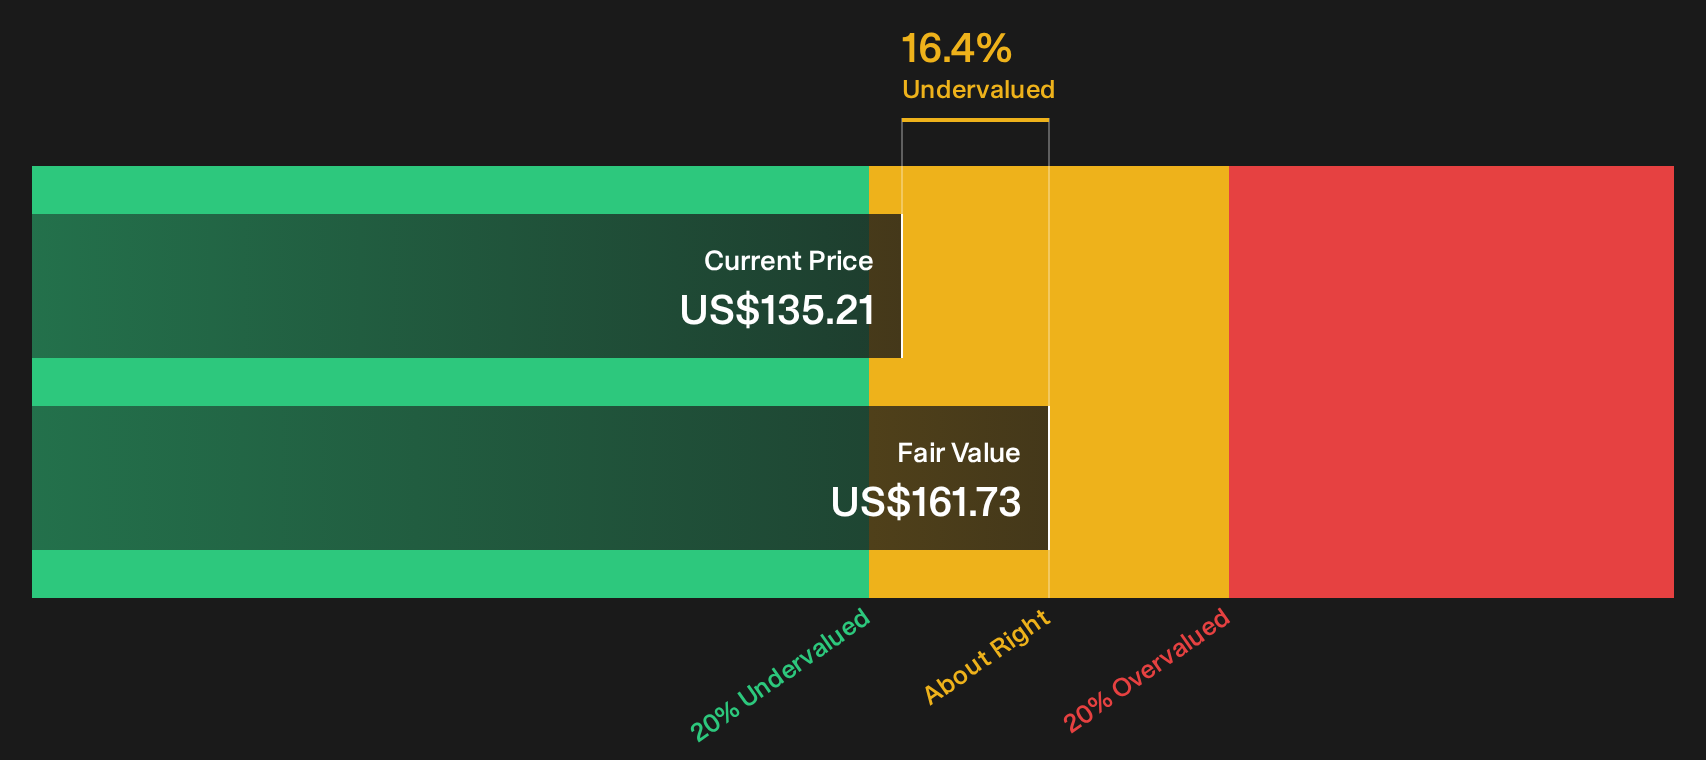
BOK Financial is modeled with Book Value of $100.11 per share and Stable EPS of $11.02 per share, based on analyst estimates for future return on equity. With an Average Return on Equity of 10.03% and a Cost of Equity of $8.79 per share, the model assigns an Excess Return of $2.23 per share. That surplus, applied to a Stable Book Value estimate of $109.82 per share, feeds into an Excess Returns valuation of about $161.73 per share.
Compared with the recent share price around $135, the Excess Returns output indicates that BOK Financial trades at roughly a 16.4% discount to this model’s estimate of intrinsic value. In other words, the market price appears to reflect an expectation that future profitability on equity will be closer to the required return than the model assumes.
On these Excess Returns assumptions, BOK Financial stock appears undervalued relative to its estimated intrinsic value according to this model.
Our Excess Returns analysis suggests BOK Financial is undervalued by 16.4%. Track this in your watchlist or portfolio, or discover 33 more high quality undervalued stocks.
Does BOK Financial Look Pricey on Earnings?
P/E works well for a bank like BOK Financial because earnings sit close to the core of how investors usually value lending and fee income businesses.
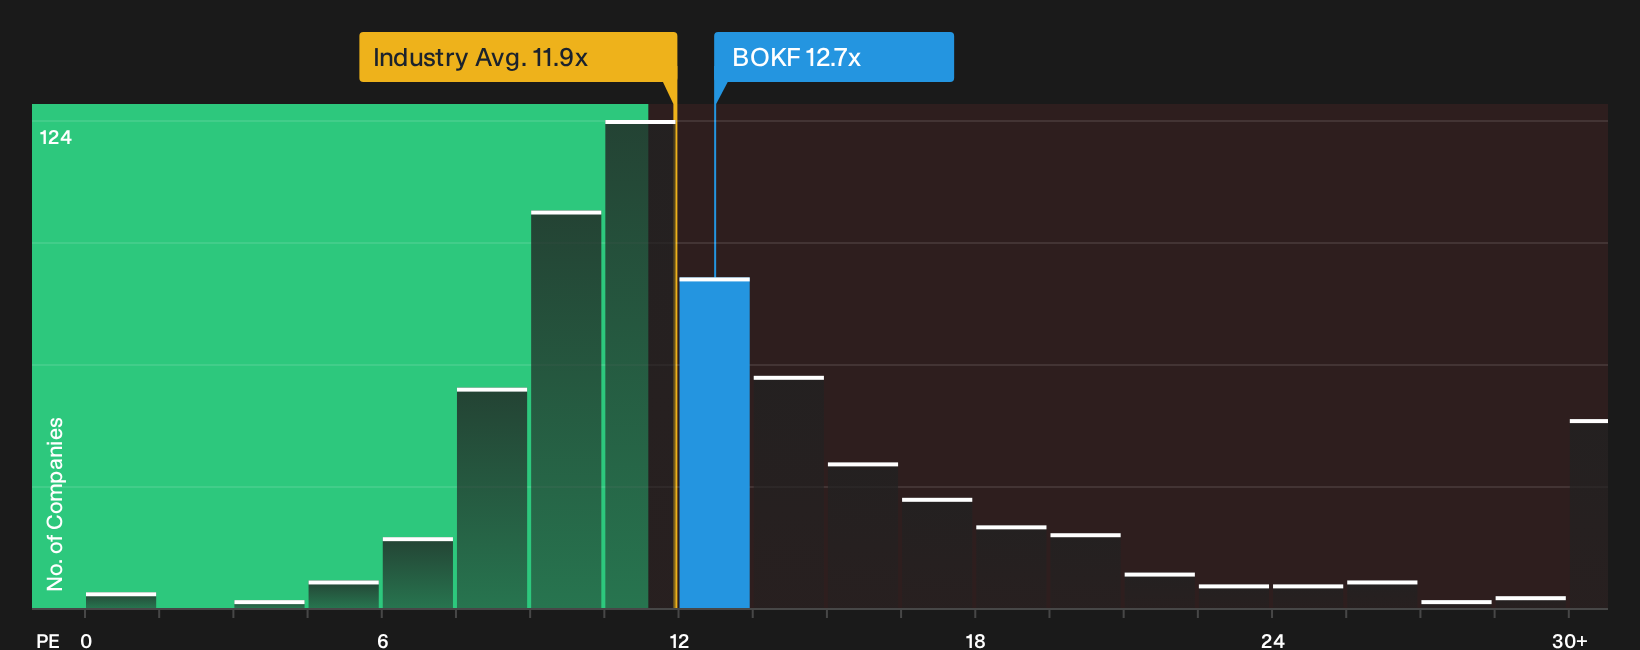
On this lens, BOK Financial trades around 12.7x earnings, which is higher than both the broader banks industry on 11.9x and its direct peer set on roughly 14.8x on average. The tailored fair P/E ratio for the company is estimated at 11.3x, which is below where the shares currently change hands. That gap suggests investors are paying a premium to what this framework flags as a balance between BOK Financial's profitability profile, size and sector risks.
For you as a shareholder or potential buyer, the takeaway is simple. The intrinsic value work points one way, while the earnings multiple signals that the market already assigns a relatively full price to the current earnings base.
On the P/E yardstick alone, BOK Financial stock appears overvalued relative to the fair multiple implied by this model.
See what the numbers say about this price — find out in our valuation breakdown.
The BOK Financial Narrative: What Would Justify Today's Price?
Simply Wall St Narratives pick up where the valuation split for BOK Financial leaves you. They spell out which paths for growth, margins and earnings would need to hold for the shares to be worth materially more or less than today’s price, and tie each possible storyline to a specific fair value. This allows you to track over time which mix of catalysts and risks is actually unfolding.
Use Simply Wall St Narratives to add your own, number driven view on where BOK Financial's growth, margins and execution go from here, and see how that thesis stacks up as new data arrives.
Share a clear, data backed Narrative on BOK Financial and be one of the first voices in the Simply Wall St community to present a structured case on the stock that others can follow over time.
Do you think there's more to the story for BOK Financial? Head over to our Community to see what others are saying!
The Bottom Line
BOK Financial offers an intrinsic value estimate from the Excess Returns model that screens as undervalued, while the P/E work points to an overvalued multiple against peers and its tailored fair ratio. That split comes from different lenses, with the intrinsic view driven by balance sheet returns and capital needs, and the market multiple shaped by sentiment around earnings durability and sector risk. Broader checks remain weak. The key judgment now is whether profitability on equity proves resilient enough to close that gap without relying on a richer earnings multiple.
This article by Simply Wall St is general in nature. We provide commentary based on historical data and analyst forecasts only using an unbiased methodology and our articles are not intended to be financial advice. It does not constitute a recommendation to buy or sell any stock, and does not take account of your objectives, or your financial situation. We aim to bring you long-term focused analysis driven by fundamental data. Note that our analysis may not factor in the latest price-sensitive company announcements or qualitative material. Simply Wall St has no position in any stocks mentioned.
Have feedback on this article? Concerned about the content? Get in touch with us directly. Alternatively, email editorial-team@simplywallst.com