


Goodyear Tire & Rubber stock has had a rough run over the past few years, yet its current valuation checks still flag it as looking cheap on several fronts. For investors watching a long slide in the share price, the question is whether that discount reflects opportunity or simply the heavy baggage of a highly leveraged, low margin business trying to repair itself.
- Over the past 5 years, Goodyear Tire & Rubber has declined 68.4%, which signals that the market has significantly marked down expectations for the business.
- The extended “Goodyear Forward” turnaround plan, together with efforts to cut capital spending, can support an improvement in cash generation over time, while the sizeable debt load and higher interest costs may keep pressure on equity value.
- On Simply Wall St's broader checks, Goodyear Tire & Rubber carries a high value score, and the stock looks inexpensive on 5 of 6 valuation angles compared with fundamentals and peers.
The issue now is whether the current discount in Goodyear Tire & Rubber shares properly reflects its debt and cash flow challenges or has pushed the valuation too low relative to the underlying business.
Compare Goodyear Tire & Rubber's deep value profile with other potentially mispriced opportunities by scanning 31 high quality undervalued stocks that share strong fundamentals and compressed valuations.
Does Goodyear Tire & Rubber Look Undervalued on Sales?
P/S is a useful lens for Goodyear Tire & Rubber because revenue is still positive while earnings and free cash flow remain under strain, so sales give you a cleaner yardstick for what the market is paying for the core business.
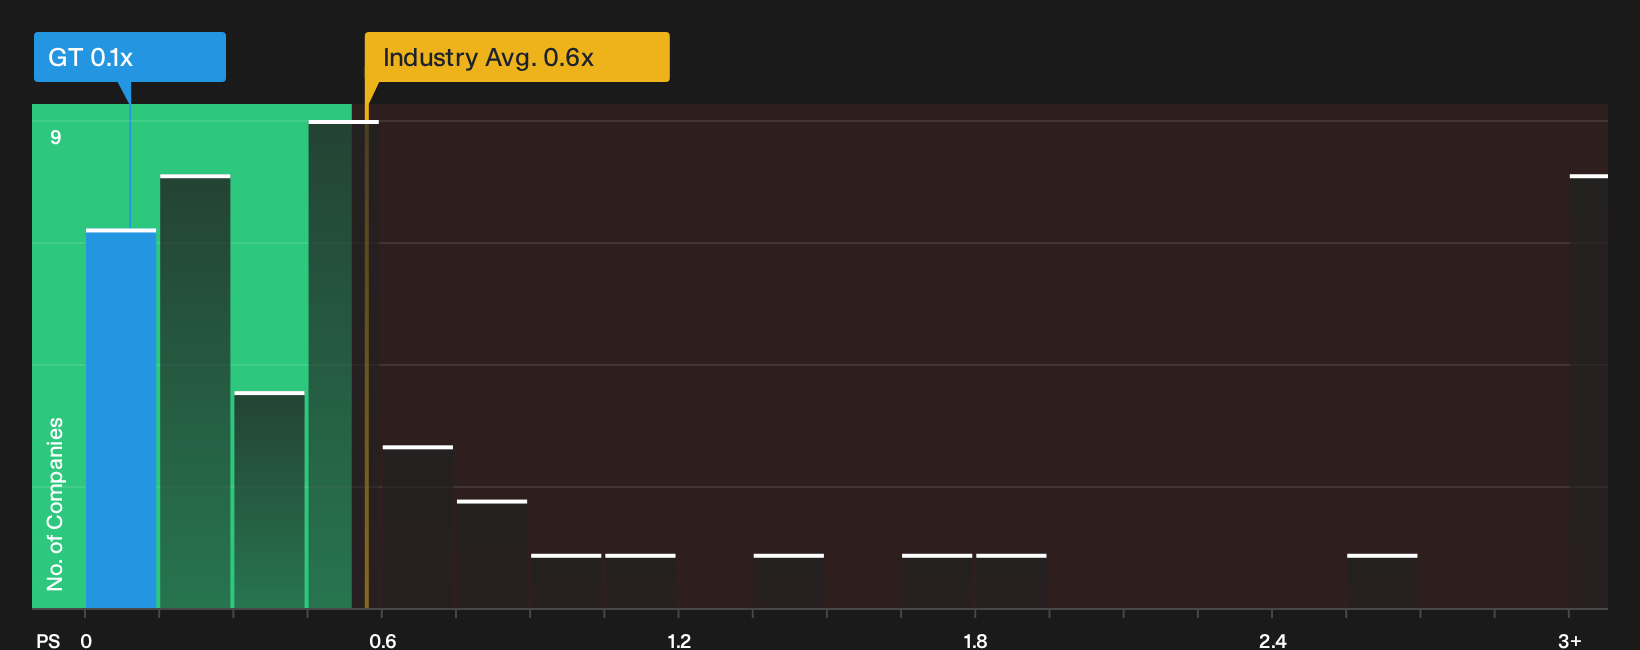
On this measure, the stock trades at about 0.1x P/S, compared with an Auto Components industry average of roughly 0.6x and a peer group around 0.4x. The internal fair P/S estimate sits near 0.4x, which is more than four times the current ratio. The market is therefore pricing Goodyear's sales base at a steep discount relative to what the model suggests for a company with its risk profile and sector position. Because the "Goodyear Forward" plan is unfolding against heavy debt and thin margins, that gap shows how much caution is already reflected in the share price rather than enthusiasm for a near term turnaround.
Recent news around ongoing cash burn and elevated interest costs helps explain why sentiment has stayed muted, even as the very low P/S multiple points to a stock that screens cheaply against fundamentals and peers.
On the P/S yardstick, Goodyear Tire & Rubber appears undervalued relative to both its industry and a more tailored fair multiple.
See what the numbers say about this price — find out in our valuation breakdown.
The Goodyear Tire & Rubber Narrative: What Would Justify Today's Price?
Simply Wall St Narratives pick up where the Goodyear Tire & Rubber valuation puzzle leaves off by spelling out which combinations of future growth, margins and earnings would need to occur for the stock to be worth meaningfully more or less than today’s price on the Community page. Each narrative links a specific fair value to a clear story about Goodyear Tire & Rubber's potential catalysts and key risks so you can track which version gradually aligns with reality over time.
One of the top community narratives on Goodyear Tire & Rubber: 28% undervalued
"The asset sales and debt reduction initiatives aim to strengthen the balance sheet, cut financial risk, and support renewed investment in growth..."
Read one of the top narratives on Goodyear Tire & Rubber
Do you think there's more to the story for Goodyear Tire & Rubber? Head over to our Community to see what others are saying!
The Bottom Line
Goodyear Tire & Rubber screens as undervalued on market multiples, especially on sales, which suggests investors are heavily discounting its balance sheet risk and thin profitability. That gap only closes if the turnaround plan steadily converts revenue into more resilient cash flow while debt and interest costs become less of a drag. The key question now is whether the low P/S ratio reflects excessive pessimism or is simply fair compensation for the leverage and execution risk that still sit in the story.
This article by Simply Wall St is general in nature. We provide commentary based on historical data and analyst forecasts only using an unbiased methodology and our articles are not intended to be financial advice. It does not constitute a recommendation to buy or sell any stock, and does not take account of your objectives, or your financial situation. We aim to bring you long-term focused analysis driven by fundamental data. Note that our analysis may not factor in the latest price-sensitive company announcements or qualitative material. Simply Wall St has no position in any stocks mentioned.
Have feedback on this article? Concerned about the content? Get in touch with us directly. Alternatively, email editorial-team@simplywallst.com