


Edison (BIT:EDNR) drew investor attention after recent price moves, with the stock last closing at €1.97. Short term returns remain mixed, while longer term figures show both setbacks and periods of stronger performance.
Recent trading hints at a modest shift in sentiment around Edison, with a 1-day share price return of 1.03% and a 7-day share price return of 3.68% contrasting with a year-to-date share price decline of 17.23% and a 1-year total shareholder return drop of 13.07%. However, the 3-year and 5-year total shareholder returns of 63.09% and 135.29% indicate that longer term holders have still seen substantial value creation.
Scan other utilities showing similar mixed momentum by reviewing our hand picked 97 resilient stocks with low risk scores alongside Edison.
Bulls point to Edison’s long term shareholder gains and recent uptick, while bears highlight the year to date slump. Which case does the current valuation evidence lean toward next?
Price-to-Earnings of 57.6x: Is it justified?
Edison shares last closed at €1.97, and current valuation signals point to a rich P/E of 57.6x compared to both local and regional peers. That multiple sits well above the peer average of 18.8x and the broader European renewable energy sector average of 23.4x, which indicates investors are paying a much higher price for each euro of reported earnings.
The P/E ratio compares the share price to earnings per share. For a utility and energy supplier like Edison, this metric gives a quick sense of how much the market is willing to pay for its profit stream relative to other businesses in the same field. A higher figure can reflect expectations for stronger future profitability, perceived stability of earnings quality, or a willingness to overlook weaker current results.
Here, the context matters. Edison has high quality earnings according to the available data, yet reported profit margins are thin at 0.9% and have fallen from 1.6% last year. Earnings have also declined by an average of 11.6% per year over the past 5 years, and profit growth over the last year has moved further into negative territory. Based on this information, such a premium P/E suggests the market is pricing the shares at a level that is not supported by the historical figures provided.
The comparison with the European renewable energy industry sharpens that point. A 57.6x P/E against a sector average of 23.4x places Edison at more than double the industry level, even as the firm has recorded earnings declines and lower margins over time. That gap signals the stock is trading on a valuation that looks expensive relative to peers given the current earnings profile.
See what the numbers say about this price — find out in our valuation breakdown.
Result: Price-to-Earnings of 57.6x (OVERVALUED)
Still, Edison’s thin 0.9% profit margin and the reported 11.6% annual earnings decline over 5 years could quickly challenge such a stretched valuation.
Find out about the key risks to this Edison narrative.
Another View: Edison Through a Cash Flow Lens
The rich P/E story runs into a very different picture once you switch to our DCF model. On that measure, Edison at €1.97 trades well above an estimated future cash flow value of €0.15, which points to a stock that screens as heavily overvalued on cash flow assumptions. If earnings are already under pressure and the price also sits far above this cash flow estimate, how confident do you feel in what the market is paying for today?
Look into how the SWS DCF model arrives at its fair value.
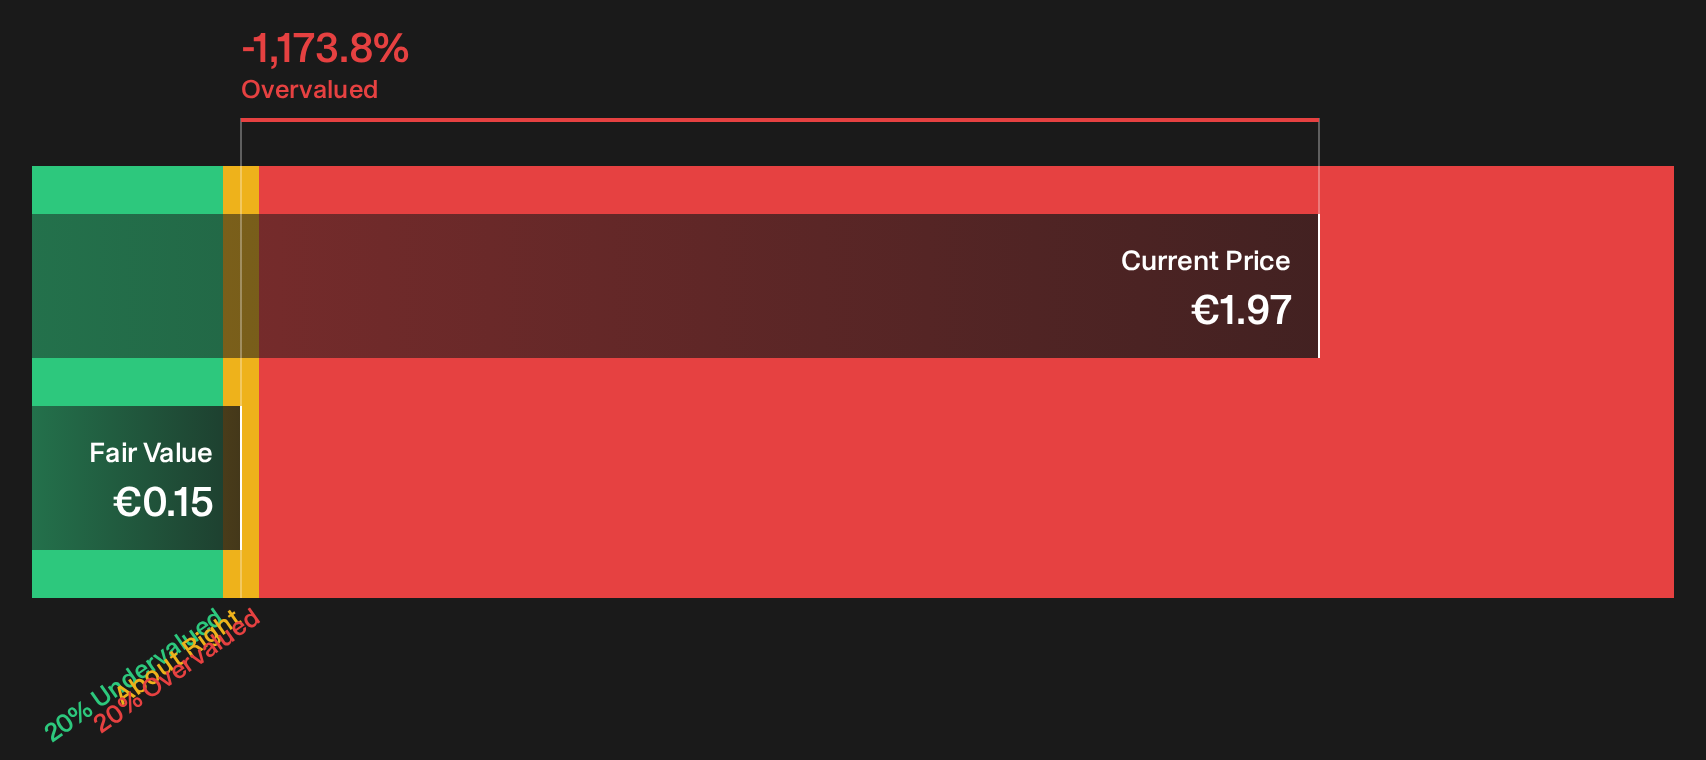
Simply Wall St performs a discounted cash flow (DCF) on every stock in the world every day (check out Edison for example). We show the entire calculation in full. You can track the result in your watchlist or portfolio and be alerted when this changes, or use our stock screener to discover 183 high quality undervalued stocks. If you save a screener we even alert you when new companies match - so you never miss a potential opportunity.
Next Steps
If the mixed tone around Edison leaves you uncertain, treat that as a cue to pressure test the data yourself and move quickly from headline impressions to hard evidence by checking the 3 important warning signs.
Ready for more ideas beyond Edison?
If Edison’s valuation leaves you questioning what else is out there, use that curiosity and line up a broader watchlist that matches your own risk and income preferences.
- Target steadier compounding by scanning a curated set of financially resilient companies through the list of solid balance sheet and fundamentals (193 results).
- Hunt for potential mispricings by checking the 183 high quality undervalued stocks that combine quality fundamentals with compressed valuations.
- Boost your income focus by reviewing the 164 dividend fortresses that aim to pair higher yields with more robust cash generation.
This article by Simply Wall St is general in nature. We provide commentary based on historical data and analyst forecasts only using an unbiased methodology and our articles are not intended to be financial advice. It does not constitute a recommendation to buy or sell any stock, and does not take account of your objectives, or your financial situation. We aim to bring you long-term focused analysis driven by fundamental data. Note that our analysis may not factor in the latest price-sensitive company announcements or qualitative material. Simply Wall St has no position in any stocks mentioned.
Have feedback on this article? Concerned about the content? Get in touch with us directly. Alternatively, email editorial-team@simplywallst.com