


General Motors has delivered a very strong 3 year share price run, yet valuation checks are sending mixed signals, with the Discounted Cash Flow (DCF) estimate pointing to meaningful upside while market based multiples lean the other way. The stock also carries a low overall value score, so the recent performance and the intrinsic value estimate are not telling the same story.
- Over the past 3 years, General Motors has returned about 159.9%, which puts extra focus on whether today’s price already reflects much of the good news in the story.
- GM’s push into areas such as battery energy storage and additional investment in high margin pickups can support long term cash generation, while product issues like the recent oil filter service bulletin highlight operational risks that can pressure costs and investor confidence.
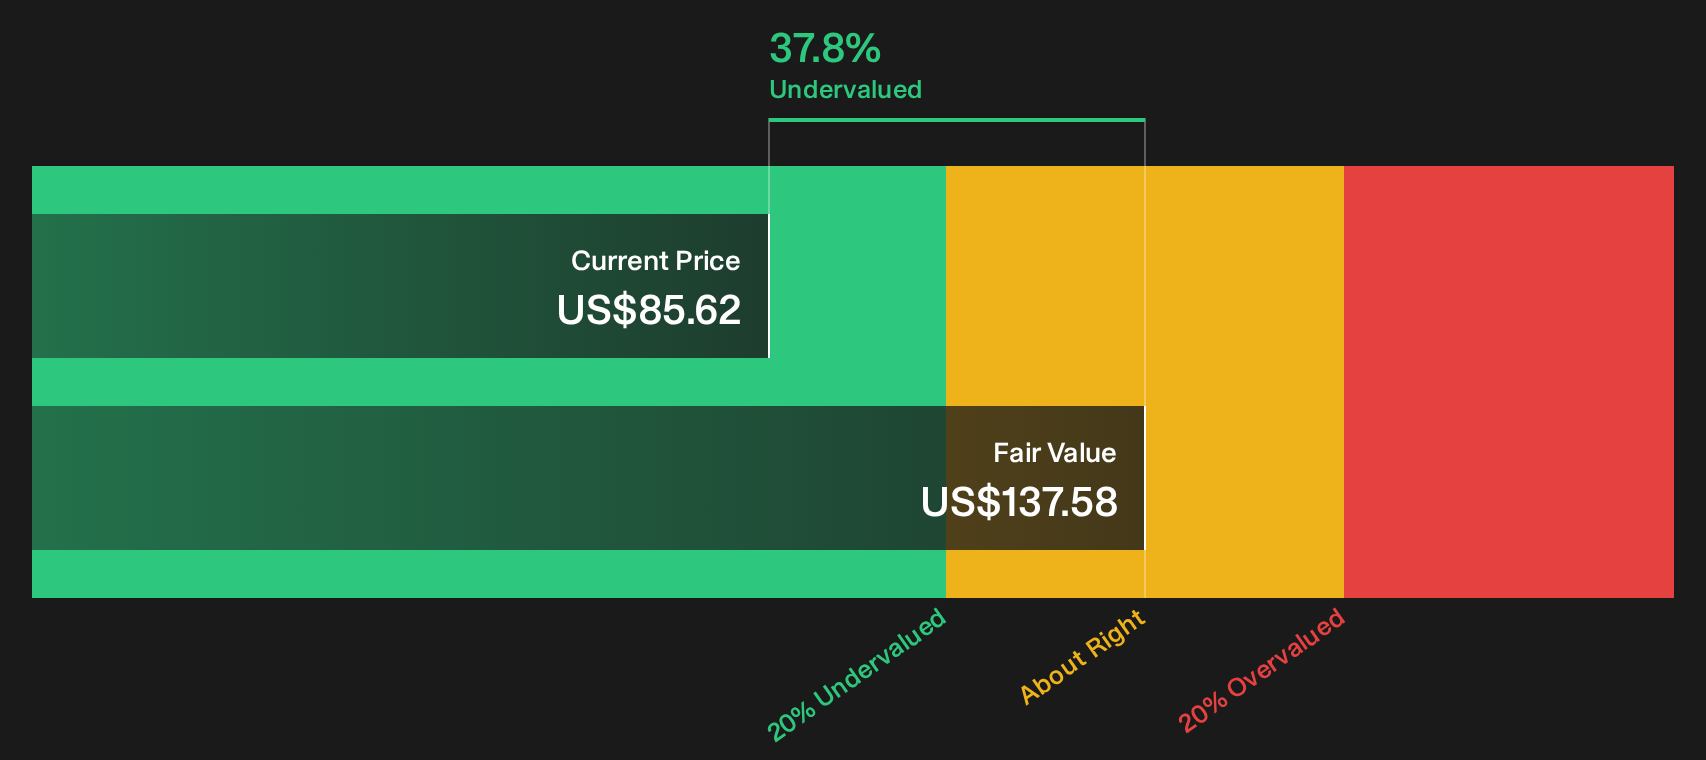
- With a low value score of 2 out of 6, General Motors does not screen as a clear bargain on the broader set of valuation checks even though the DCF intrinsic value estimate suggests the shares trade about 37.8% below that level.
The issue now is whether the DCF style intrinsic value or the richer looking market multiples are giving the more reliable signal on where General Motors stock sits today.
Spot opportunities beyond General Motors by scanning 31 high quality undervalued stocks, which our process highlights for strong fundamentals and potential value gaps.Does General Motors Look Undervalued on Cash Flow?
The Discounted Cash Flow (DCF) model estimates what General Motors could be worth based on the cash it is expected to generate for shareholders. For GM, the latest twelve month free cash flow sits at about $13.1b, and the model assumes these cash flows continue to grow from current levels rather than swing sharply lower or higher.
On those projections, the 2 Stage Free Cash Flow to Equity model points to an intrinsic value of about $138 per share, which implies the stock trades roughly 37.8% below that estimate. The recent push into battery energy storage and continued spending on high margin pickups helps explain why some investors are willing to look through operational issues like the oil filter bulletin when weighing that cash flow stream. The DCF outcome suggests General Motors stock currently appears undervalued relative to the cash flows embedded in this model.
Our Discounted Cash Flow (DCF) analysis suggests General Motors is undervalued by 37.8%. Track this in your watchlist or portfolio, or discover 31 more high quality undervalued stocks.
Does General Motors Look Pricey on Earnings?
P/E is a clean way to sanity check General Motors because earnings stay front and center for a mature manufacturer that still depends heavily on vehicles and parts for profit.
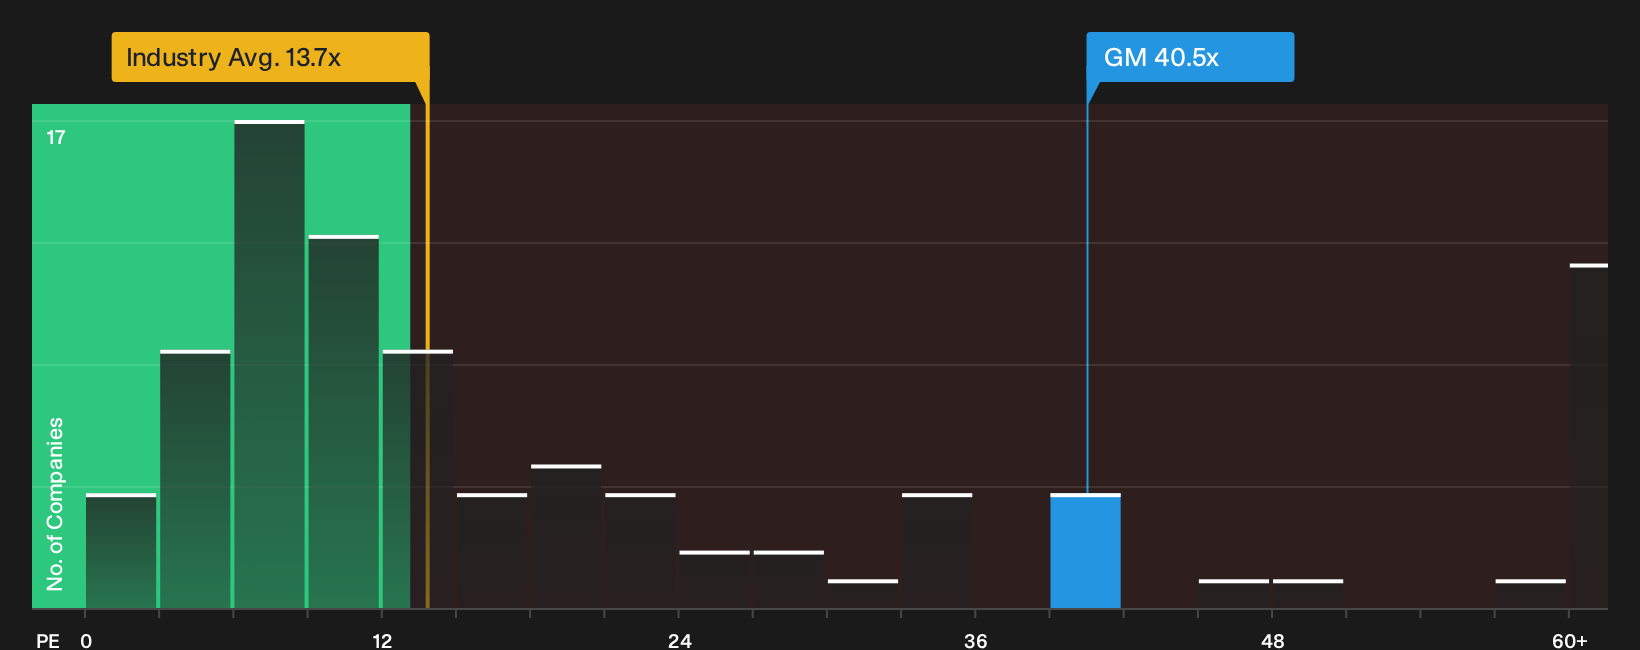
On this yardstick, the snapshot is punchy. GM trades at about 40.5x earnings, while the broader auto industry sits near 13.7x and the peer group averages roughly 27.5x. The tailored fair P/E for GM, which blends its profitability profile, size and risk factors, comes out at about 25.6x. That is a wide gap to the current multiple and indicates that investors are paying a rich price per dollar of current earnings for General Motors.
The spread between today’s P/E and the modelled fair level points to a valuation that leans heavily on an optimistic earnings narrative rather than on simple sector norms.
On the P/E yardstick, General Motors stock currently screens as overvalued relative to what the model suggests would be a more balanced earnings multiple.
See what the numbers say about this price — find out in our valuation breakdown.
The General Motors Narrative: What Would Justify Today's Price?
Simply Wall St Narratives pick up where the DCF and P/E tension for General Motors leaves off. Each one spells out what would need to happen to General Motors' growth, margins and earnings for the equity to be worth materially more or less than today. Rather than focusing on a single multiple or model result, they lay out the assumptions behind that fair value view so you can track them as new numbers arrive.
Community views on General Motors are split wide apart, with one camp leaning into software and services upside while the other worries about the cost and risk of the transition.
Bull case: 14% undervalued
"The growing monetization of software and services such as Super Cruise and OnStar, evidenced by $4 billion in deferred revenue and rapid subscriber growth, creates higher-margin recurring revenue streams, supporting long-term earnings expansion beyond traditional vehicle sales..."
Read the full Bull Case to see why General Motors could be undervalued
Bear case: 28% overvalued
"EVs are still margin-dilutive for GM. Battery costs, manufacturing inefficiencies, and supply chain constraints continue to pressure profitability..."
Read the full Bear Case to see why General Motors could be overvalued
Do you think there's more to the story for General Motors? Head over to our Community to see what others are saying!
The Bottom Line
For General Motors, the Discounted Cash Flow (DCF) work points to meaningful upside, while the P/E view flags the shares as expensive against earnings. That split comes from the DCF leaning on longer term cash generation and capital needs, while the market multiple leans on what investors are willing to pay today given growth expectations and sentiment toward autos. Broader valuation checks remain weak, so the intrinsic value signal needs to be weighed against that sceptical read. The real swing factor from here is whether GM can turn its software, EV and truck investments into durable, higher quality cash flows rather than value trapped capital.
This article by Simply Wall St is general in nature. We provide commentary based on historical data and analyst forecasts only using an unbiased methodology and our articles are not intended to be financial advice. It does not constitute a recommendation to buy or sell any stock, and does not take account of your objectives, or your financial situation. We aim to bring you long-term focused analysis driven by fundamental data. Note that our analysis may not factor in the latest price-sensitive company announcements or qualitative material. Simply Wall St has no position in any stocks mentioned.
Have feedback on this article? Concerned about the content? Get in touch with us directly. Alternatively, email editorial-team@simplywallst.com