


Huntsman stock is caught between two clashing valuation signals, with an intrinsic value estimate pointing to a premium to the current price while market multiples suggest the shares may already be on the cheap side.
- The share price has fallen about 57.5% over the past 3 years. This leaves investors asking whether the current level reflects cyclical pressure or a deeper reset in Huntsman’s earnings power.
- Future cash generation can benefit if Huntsman converts more of its revenue into steady free cash flow. However, any prolonged squeeze on margins would limit how much value that cash can add.
- The overall value score of 3 out of 6 gives a mixed picture rather than a clear bargain or clear overvaluation for Huntsman on the combined checks.
The issue now is whether Huntsman’s current share price already reflects cautious expectations, or if investors are still paying too much relative to what the cash flows and market multiples imply.
Compare Huntsman’s mixed 3 out of 6 value score and DCF overvaluation signal against other potential ideas by scanning our hand picked 31 high quality undervalued stocks.
Has Huntsman Run Too Far on Cash Flow?
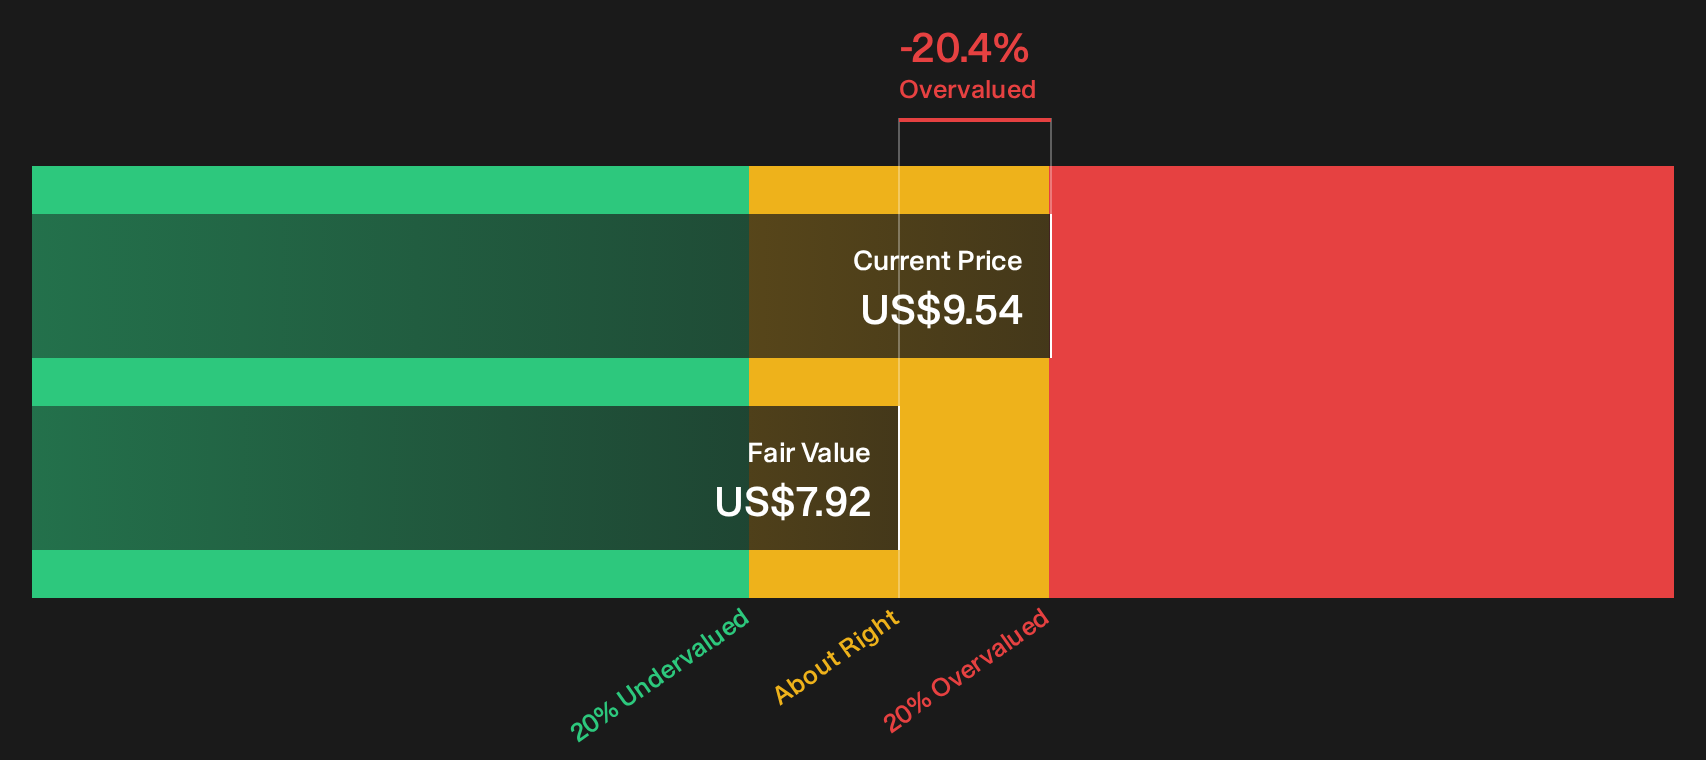
The Discounted Cash Flow (DCF) approach values Huntsman by projecting future cash the business can return to shareholders and then discounting it back to today. For Huntsman, the latest twelve month free cash flow was a loss of $26.82 million, so the model leans heavily on a recovery path rather than steady historic cash generation.
Analysts and model estimates point to future free cash flows moving into positive territory, with a declining growth profile over the longer projection window. On those assumptions, the DCF framework arrives at an intrinsic value of about $7.92 per share. That sits below the current market price, which is consistent with the model’s indication that the stock screens roughly 20.4% overvalued based on these cash flow forecasts.
On this cash flow view, Huntsman currently screens as overvalued relative to its DCF based intrinsic value estimate.
Our Discounted Cash Flow (DCF) analysis suggests Huntsman may be overvalued by 20.4%. Discover 31 high quality undervalued stocks or create your own screener to find better value opportunities.
Does Huntsman Look Undervalued on Sales?
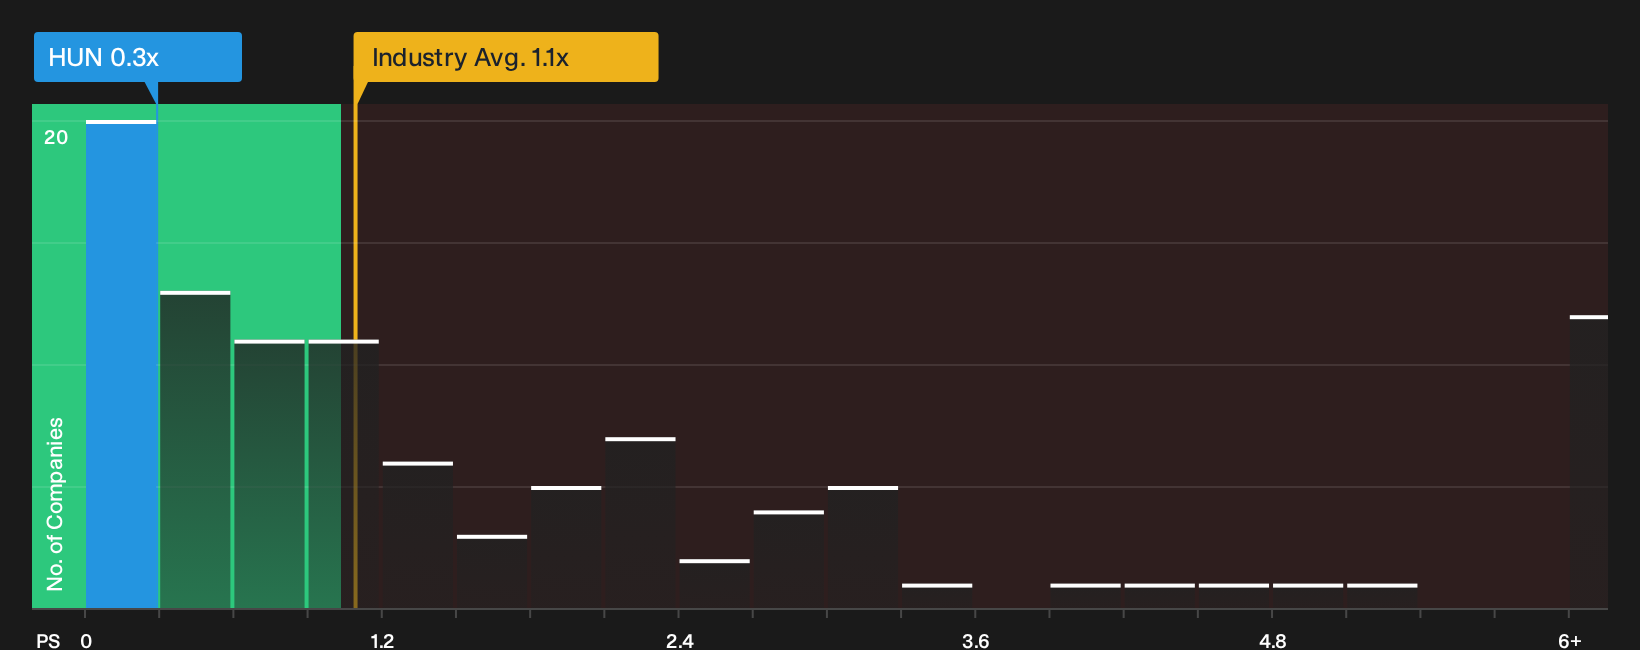
For a cyclical chemicals business like Huntsman, the P/S ratio helps you compare what the market is paying for each dollar of revenue, even when earnings are bumpy.
Huntsman trades on a P/S of about 0.3x, while the broader chemicals industry averages roughly 1.1x and the peer group sits near 1.0x. The fair P/S ratio from the model, which blends factors such as growth profile, profitability, size and risk, comes out at around 0.8x. That is well above where the shares currently change hands, so the stock is pricing in a large discount to what this framework suggests could be reasonable.
Investors looking at Huntsman purely through the sales multiple lens therefore see a valuation that already incorporates cautious expectations compared with sector norms and the modelled fair level.
On the P/S check, Huntsman appears undervalued relative to both its industry and the model’s fair multiple.
See what the numbers say about this price — find out in our valuation breakdown.
The Huntsman Narrative: What Would Justify Today's Price?
Simply Wall St Narratives pick up where Huntsman’s valuation split leaves off and explain which combinations of revenue growth, margin profile and earnings path would need to occur for Huntsman’s share price to look materially higher or lower than it does today. Rather than focusing on a single multiple or model output, each scenario sets out its own fair value assumptions so you can compare them with Huntsman’s reported numbers as they are released.
One of the top community narratives on Huntsman: 19% undervalued
"The company is actively transforming its portfolio away from lower-margin, commodity chemicals toward specialty chemicals, aiming to further improve EBITDA margins and overall profitability in future cycles…"
Read one of the top narratives on Huntsman
Do you think there's more to the story for Huntsman? Head over to our Community to see what others are saying!
The Bottom Line
Huntsman offers a split message, with the Discounted Cash Flow (DCF) view pointing to an overvalued share price while the sales multiple suggests the stock trades on a discounted P/S versus peers. That gap reflects a clash between cautious assumptions on future free cash generation and a market that already prices in weaker growth and margins than the sector. With broader checks giving a mixed read, the key question is whether Huntsman can convert revenue into durable free cash flow, or whether the current discount on sales simply matches the pressure on its earnings power.
This article by Simply Wall St is general in nature. We provide commentary based on historical data and analyst forecasts only using an unbiased methodology and our articles are not intended to be financial advice. It does not constitute a recommendation to buy or sell any stock, and does not take account of your objectives, or your financial situation. We aim to bring you long-term focused analysis driven by fundamental data. Note that our analysis may not factor in the latest price-sensitive company announcements or qualitative material. Simply Wall St has no position in any stocks mentioned.
Have feedback on this article? Concerned about the content? Get in touch with us directly. Alternatively, email editorial-team@simplywallst.com