


Sysco stock has delivered a 27.3% gain over the past three years, and current checks suggest the market price may still sit below what its cash flows imply, with the Discounted Cash Flow (DCF) estimate indicating material undervaluation that aligns with what earnings multiples are signaling.
- A 27.3% return over three years indicates that Sysco has already rewarded patient holders, but not to a degree that clearly exhausts further upside potential based on recent valuation work.
- A planned US$500m AI efficiency program and the pending Jetro Restaurant Depot acquisition may support higher long-term cash generation. However, the additional leverage and integration demands could pressure valuation if execution or cost savings fall short of expectations.
- A mixed overall value score, with Sysco screening as undervalued in several checks, points to a company that is neither a clear bargain nor a clear premium, as shown by the 4 out of 6 score.
The issue now is whether Sysco's recent initiatives and deal making justify the discount implied by the intrinsic value estimates, or whether the current share price already captures most of the realistic payoff.
Scan beyond Sysco and spot other potential value plays where cash flow, balance sheet strength, and pricing all line up in our curated 31 high quality undervalued stocks list.
Is Sysco Still Cheap on Cash Flow?
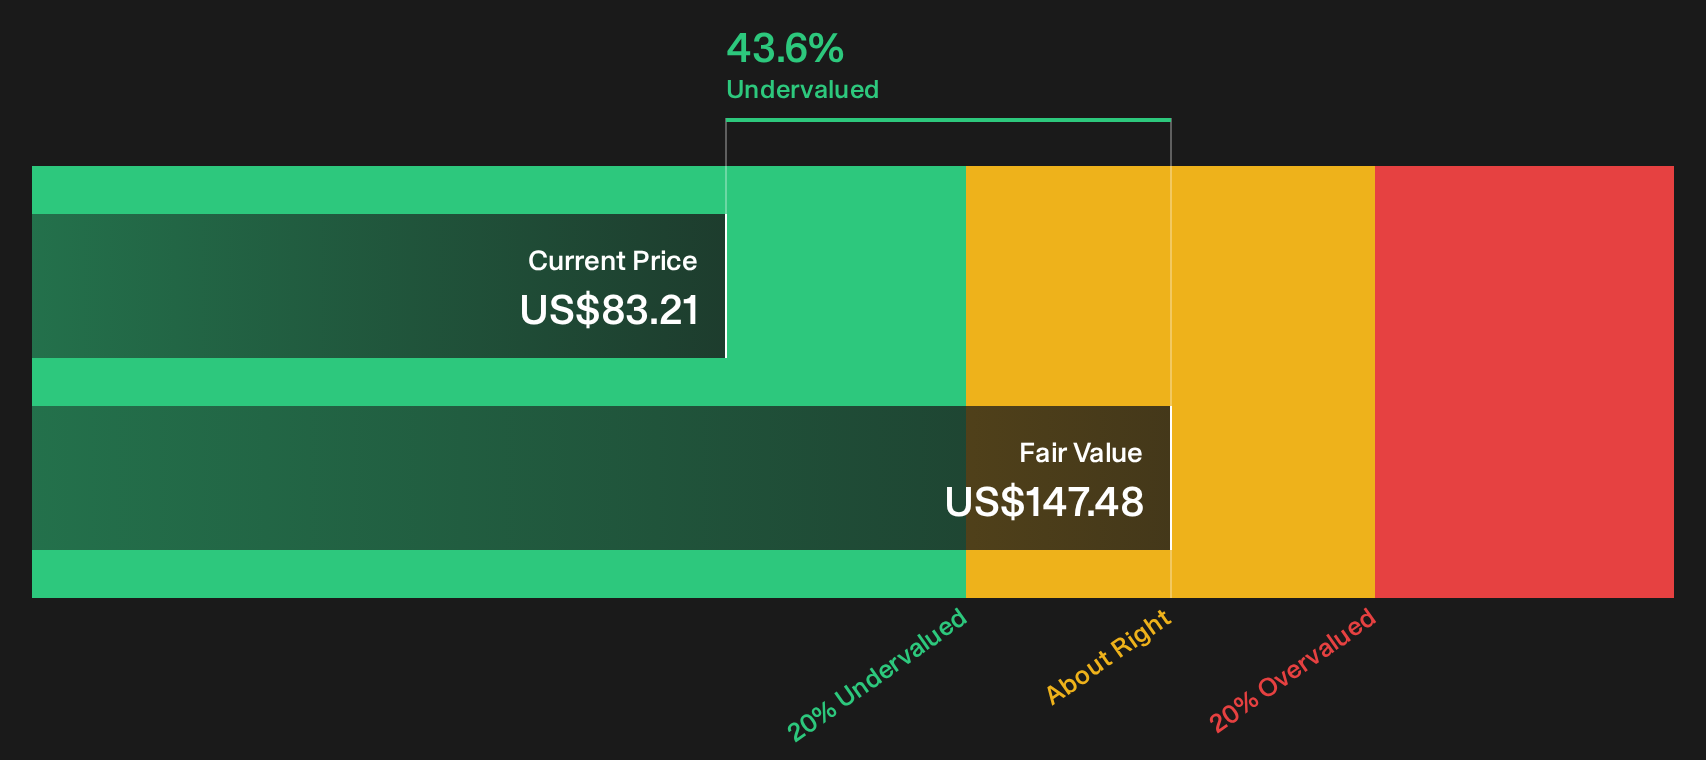
The Discounted Cash Flow (DCF) framework used here takes Sysco’s projected cash generation and discounts it back to today’s dollars. On this model, the business is producing trailing twelve month free cash flow of about $1.8b, with forecasts assuming growing cash flows rather than a one-off spike. Plugging those projections into a two-stage free cash flow to equity setup points to an estimated intrinsic value of about $147 per share.
That value is roughly 43.6% above the current share price, so the stock presents as materially undervalued on this cash flow view. Sysco’s planned $500m AI efficiency program provides some rationale for the growth assumptions in the model, as the market price remains below the level suggested by the projected cash flows. On balance, the DCF analysis indicates that Sysco stock appears undervalued relative to the cash it is expected to generate.
Our Discounted Cash Flow (DCF) analysis suggests Sysco is undervalued by 43.6%. Track this in your watchlist or portfolio, or discover 31 more high quality undervalued stocks.
Is Sysco Still Cheap on Earnings?
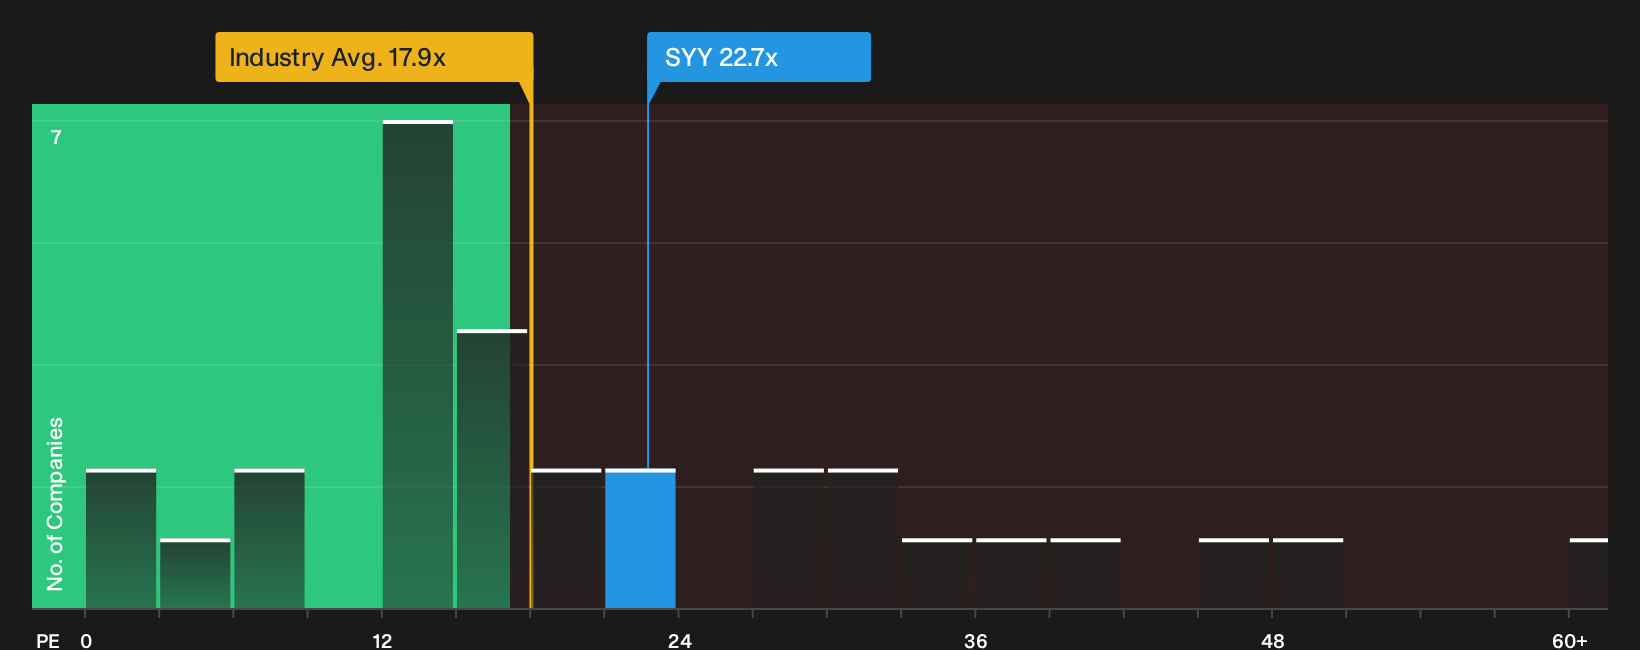
P/E is a useful lens for Sysco because earnings remain a key driver of how investors value established consumer-facing distributors. On this measure, Sysco trades on roughly 22.7x earnings, which is below both the consumer retailing peer average of about 33.0x and the sector-wide P/E of 17.9x.
The fair P/E ratio implied for Sysco by the valuation work is about 30.9x. That is materially higher than where the shares change hands today, which indicates a discount even after adjusting for the company’s scale, margins and risk profile. The gap between the current 22.7x and the 30.9x fair level indicates that the market is assigning a lower earnings multiple than the model points to for a business of Sysco’s characteristics.
On balance, Sysco stock appears undervalued on the P/E multiple when compared with the level indicated by its tailored fair ratio.
See what the numbers say about this price — find out in our valuation breakdown.
The Sysco Narrative: What Would Justify Today's Price?
Sysco’s valuation story only really comes into focus once you see the assumptions sitting underneath it. Narratives on Simply Wall St’s Community page act as that missing bridge from the cash flow and earnings puzzle to concrete paths the business might follow. Each one treats fair value as a thesis about Sysco’s future growth, margins and earnings that you can track over time, rather than a one off snapshot.
Share a narrative on Sysco that puts real numbers behind your view on whether the US$500m AI efficiency program and the Jetro Restaurant Depot deal deliver on their promise. Add your voice to the Simply Wall St community and track how your thesis holds up as new results and updates are released.
Do you think there's more to the story for Sysco? Head over to our Community to see what others are saying!
The Bottom Line
Sysco screens as undervalued on both the Discounted Cash Flow (DCF) work and the earnings multiple view, yet broader checks still flag a mixed picture rather than a slam dunk. The gap between intrinsic value estimates and today’s pricing only really closes if the AI efficiency push and the Jetro Restaurant Depot deal translate into durable cash flow gains without stressing the balance sheet. For investors weighing Sysco now, the key question is whether that execution risk explains the discount or whether the market is underpricing the potential uplift in earnings power.
This article by Simply Wall St is general in nature. We provide commentary based on historical data and analyst forecasts only using an unbiased methodology and our articles are not intended to be financial advice. It does not constitute a recommendation to buy or sell any stock, and does not take account of your objectives, or your financial situation. We aim to bring you long-term focused analysis driven by fundamental data. Note that our analysis may not factor in the latest price-sensitive company announcements or qualitative material. Simply Wall St has no position in any stocks mentioned.
Have feedback on this article? Concerned about the content? Get in touch with us directly. Alternatively, email editorial-team@simplywallst.com