


TechnipFMC has turned a very large 5 year gain into a valuation puzzle, with the Discounted Cash Flow (DCF) estimate pointing to a meaningful discount while market multiples lean rich. The stock’s recent run leaves investors weighing a DCF based intrinsic value that suggests upside against a market price that already builds in strong expectations.
- Over 5 years, TechnipFMC has delivered a return of about 10x; this puts extra weight on whether the current share price still leaves room for a reasonable margin of safety.
- Future cash generation from its project backlog and services work can support the DCF view, while execution missteps or delayed offshore spending may pressure the cash flows that underpin that intrinsic value estimate.
- The broader valuation checks form a mixed picture rather than a clear bargain or clear overvaluation, with TechnipFMC scoring 4 out of 6 on the value score framework.
The issue now is whether TechnipFMC’s current price better reflects the richer earnings multiples or the DCF based estimate that signals the stock trades at a discount.
Compare TechnipFMC’s sharp 5 year rerating with other potential value setups by scanning 31 high quality undervalued stocks, which pairs solid fundamentals with pricing that still looks disciplined.
Is TechnipFMC a Bargain on Cash Flow?
The Discounted Cash Flow (DCF) model here focuses on what TechnipFMC can generate for shareholders rather than where earnings multiples sit today. Latest twelve month free cash flow sits around $1.56b, which gives the business funding power from its own operations. The projections assume growing cash flows rather than a one off spike, reflecting expectations that the existing project pipeline continues to convert into steady cash generation.
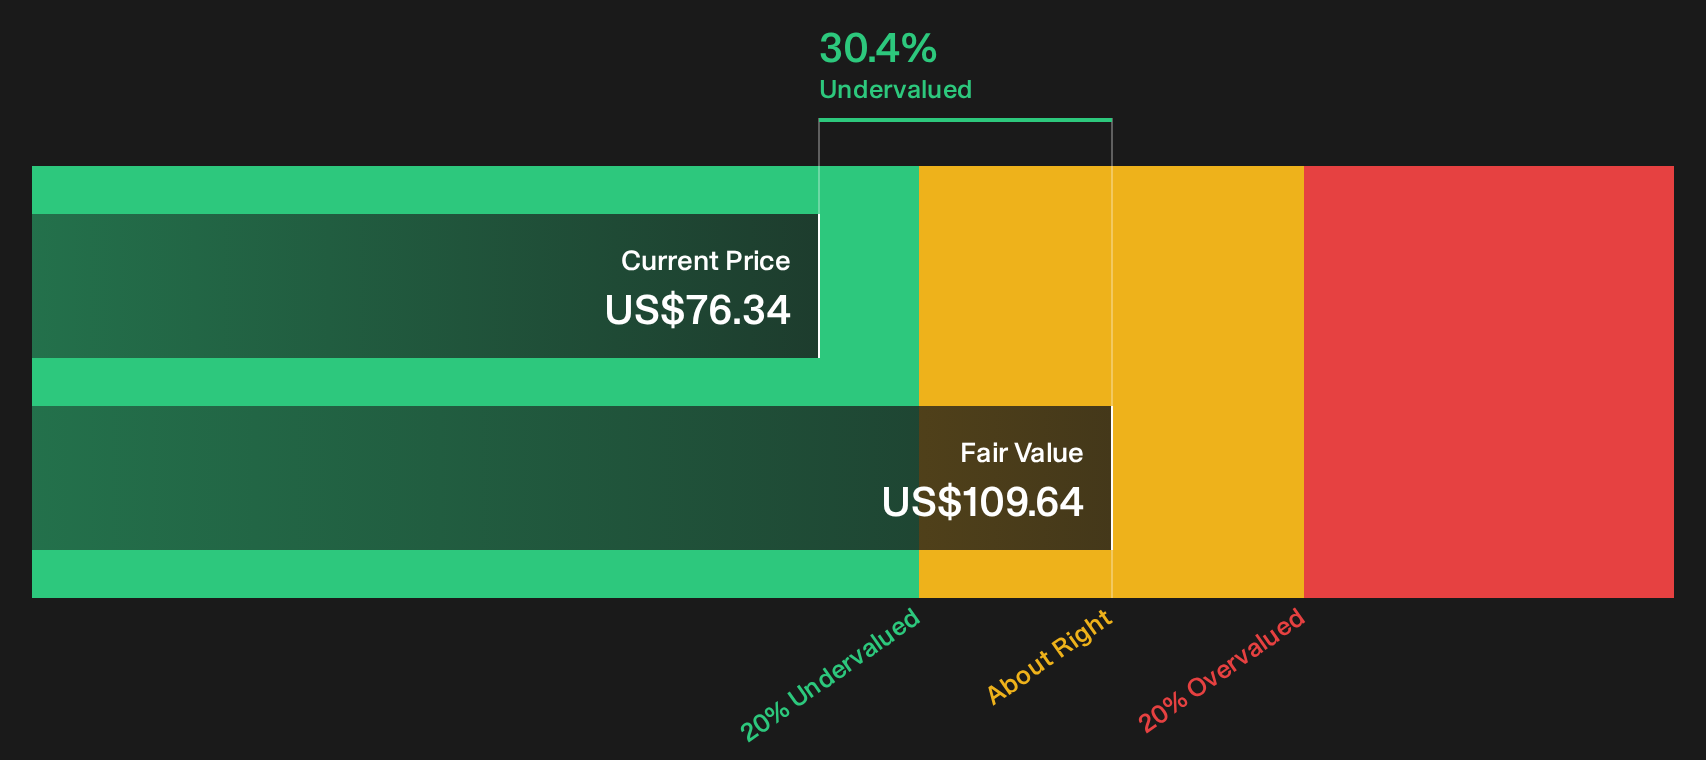
On those inputs, the DCF framework points to an intrinsic value of about $110 per share. Compared with the current market price, that implies the stock trades at a 30.4% discount. For anyone weighing TechnipFMC after a strong multi year share price move, this cash flow based view frames the shares as offering a cushion relative to what the model estimates for long term value.
On this cash flow outlook, TechnipFMC screens as undervalued relative to its DCF based intrinsic value estimate.
Our Discounted Cash Flow (DCF) analysis suggests TechnipFMC is undervalued by 30.4%. Track this in your watchlist or portfolio, or discover 31 more high quality undervalued stocks.
Has TechnipFMC Run Too Far on Earnings?
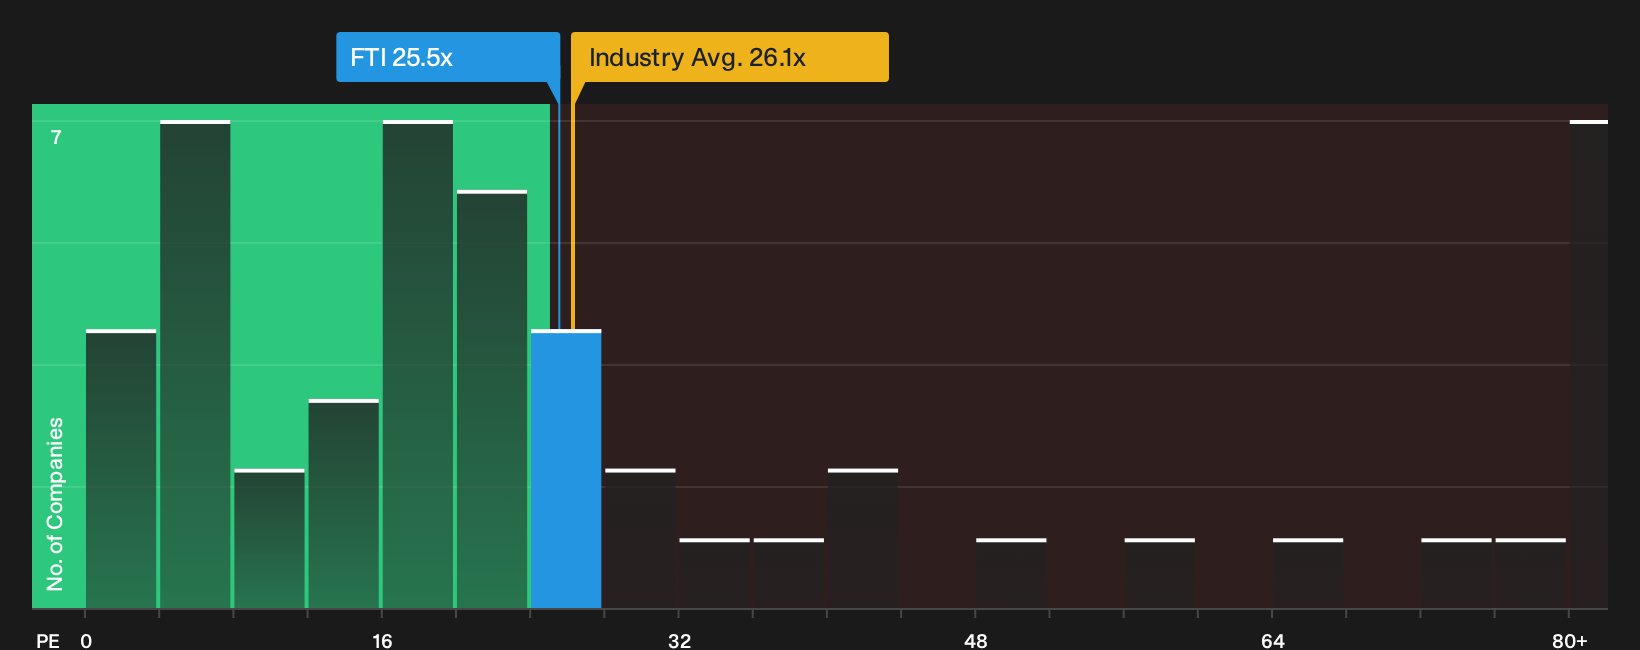
P/E fits TechnipFMC because earnings now provide a clear anchor for what investors are paying per dollar of profit. On this lens, the stock trades around 25.5x earnings, which is very close to the Energy Services sector average of about 26.1x and below the broader peer group on roughly 35.9x. That keeps the company from looking wildly stretched against the sector, even if it is not the cheapest option in the group.
The fair P/E ratio implied by the model sits nearer 20.0x, which is lower than both the market price and the sector benchmark. That gap suggests the current valuation already bakes in stronger qualities than the framework assigns based on factors such as risk profile, profitability and size. In other words, investors are paying a premium relative to what this earnings based model flags as a more restrained multiple.
On the P/E scorecard, TechnipFMC currently screens as overvalued compared with the multiple that would typically match its profile.
See what the numbers say about this price — find out in our valuation breakdown.
The TechnipFMC Narrative: What Would Justify Today's Price?
Simply Wall St Narratives pick up where TechnipFMC's valuation puzzle leaves off by spelling out which assumptions on growth, profitability and earnings would need to hold for the share price to look meaningfully higher or lower than it is today, and they sit on the platform's Community page. Rather than focusing on a single multiple or model output, each narrative sets out its own fair value assumptions so you can later compare those inputs with TechnipFMC's actual results as they are reported.
Community narratives around TechnipFMC could hardly be further apart, with one camp leaning into upside from subsea growth and buybacks while another worries the valuation already prices in a lot of that optimism.
Bull case: 12% undervalued
"Broad adoption of integrated subsea execution models (iEPCI and Subsea 2.0), alongside a record service backlog and direct awards from major operators, should continue to drive higher market share, order stability and visibility…"
Read the full Bull Case to see why TechnipFMC could be undervalued
Bear case: roughly fairly valued
"TechnipFMC's heavy dependence on Subsea and Surface Technologies tied to oil & gas production leaves it exposed to long-term secular trends toward decarbonization and reduced demand for fossil fuels, which could lead to a shrinking addressable market and declining revenues over time…"
Read the full Bear Case to see why TechnipFMC could be overvalued
Do you think there's more to the story for TechnipFMC? Head over to our Community to see what others are saying!
The Bottom Line
TechnipFMC screens as undervalued on the Discounted Cash Flow (DCF) intrinsic value estimate, yet looks overvalued on the P/E yardstick that anchors to sector peers. That clash mostly comes down to where you place more weight: on future cash generation from the backlog and capital intensity, or on today’s earnings multiple and how much optimism is already in the price. After such a strong multi year move, expectations have stretched, which makes the split between the models more stark. The real hinge now is whether TechnipFMC converts its project pipeline into durable free cash flow without major execution or offshore spending setbacks.
This article by Simply Wall St is general in nature. We provide commentary based on historical data and analyst forecasts only using an unbiased methodology and our articles are not intended to be financial advice. It does not constitute a recommendation to buy or sell any stock, and does not take account of your objectives, or your financial situation. We aim to bring you long-term focused analysis driven by fundamental data. Note that our analysis may not factor in the latest price-sensitive company announcements or qualitative material. Simply Wall St has no position in any stocks mentioned.
Have feedback on this article? Concerned about the content? Get in touch with us directly. Alternatively, email editorial-team@simplywallst.com