


Jacobs Solutions (J) just picked up a trio of new assignments, ranging from Dublin’s MetroLink rail build to Oklahoma City wastewater operations and an Irish Sea energy storage project, giving investors fresh contract activity to assess.
Those contract wins arrive after a mixed year for Jacobs Solutions’ equity, with the share price at $141.85 and a 90-day share price return of 13.64% contrasting with a year-to-date share price gain of 4.80% and a 1-year total shareholder return that has slipped 2.30%. At the same time, the 3-year and 5-year total shareholder returns of 32.48% and 40.17% point to momentum that has been built over a longer horizon.
Scan how Jacobs Solutions fits alongside other infrastructure heavyweights by reviewing the hand picked 39 power grid technology and infrastructure stocks that advances large scale transport, water and energy networks worldwide.
After a 13.64% move over 90 days and only modest gains year to date, Jacobs Solutions sits at a crossroads. Has the recent contract buzz already been priced in, or is valuation still playing catch up?
Most Popular Narrative: 12% Undervalued
Jacobs Solutions closed at $141.85 against a narrative fair value of $161.80, which frames the recent contract wins as part of a larger, backlog driven story.
Record-high backlog growth (up 14% year-over-year) in Water, Advanced Facilities, and Critical Infrastructure driven by global infrastructure modernization, water scarcity, and data center expansion provides strong visibility into multi-year revenue growth and supports confidence in accelerating top-line results into FY '26 and beyond.
See why 18 investors see Jacobs Solutions as 12% undervalued.
Result: Fair Value of $161.80 (UNDERVALUED)
Still, the Jacobs Solutions story can break if governments pull back on infrastructure budgets, or if long, complex projects run into costly execution snags.
Find out about the key risks to this Jacobs Solutions narrative.
Another View On Jacobs Solutions Valuation
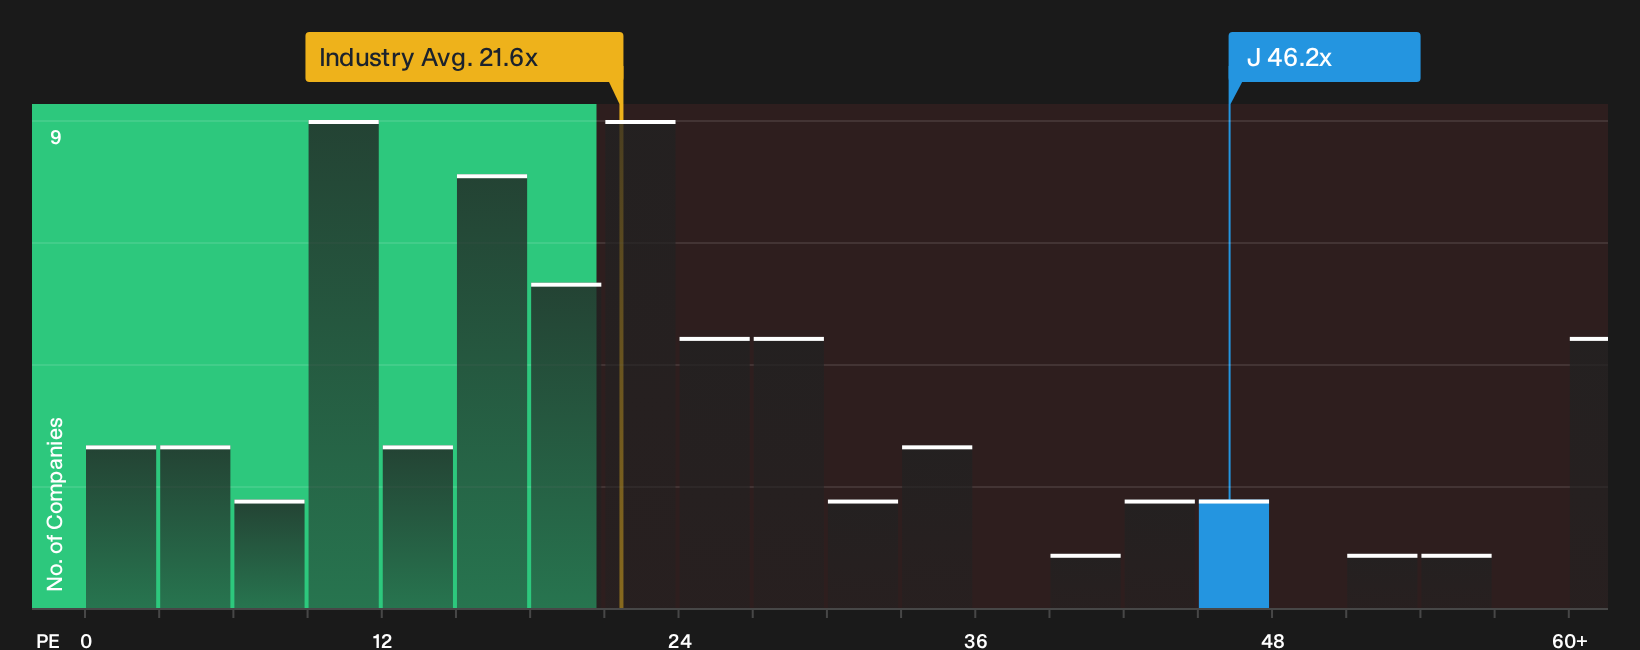
The earlier narrative framed Jacobs Solutions as undervalued against a fair value of $161.80, supported by backlog and analyst expectations. A different lens uses the current P/E of 46.2x, which is far above the US Professional Services average of 21.6x and a fair ratio estimate of 34.6x. This raises the question of how much optimism is already in the price.
For investors weighing these mixed signals, the gap between today’s rich earnings multiple and the lower fair ratio highlights valuation risk if sentiment changes relative to profit trends. See what the numbers say about this price — find out in our valuation breakdown.
Next Steps
Mixed signals around Jacobs Solutions can feel messy, especially with fresh contracts on one side and valuation questions on the other. Move quickly, review the numbers yourself, and assess the balance of 2 key rewards and 3 important warning signs.
Looking For More Investment Ideas Beyond Jacobs Solutions?
If Jacobs Solutions has you thinking harder about opportunity and risk, broaden your next move with a few focused shortlists that surface very different types of potential.
Use these curated ideas to pressure test your convictions, spot patterns across sectors, and avoid leaving promising candidates off your radar completely.
- Target resilient compounding potential by scanning companies with strong fundamentals and robust finances using the list of solid balance sheet and fundamentals (23 results).
- Hunt for mispriced opportunities by checking a focused group of attractively valued businesses through the 32 high quality undervalued stocks.
- Prioritise downside protection by reviewing a curated pool of steadier performers via the 11 resilient stocks with low risk scores.
This article by Simply Wall St is general in nature. We provide commentary based on historical data and analyst forecasts only using an unbiased methodology and our articles are not intended to be financial advice. It does not constitute a recommendation to buy or sell any stock, and does not take account of your objectives, or your financial situation. We aim to bring you long-term focused analysis driven by fundamental data. Note that our analysis may not factor in the latest price-sensitive company announcements or qualitative material. Simply Wall St has no position in any stocks mentioned.
Have feedback on this article? Concerned about the content? Get in touch with us directly. Alternatively, email editorial-team@simplywallst.com