


SPS Commerce (SPSC) is scheduled to present at Citi’s 2026 Global TMT Conference on September 9 in New York, highlighting its supply chain software model to a broad institutional audience.
The recent move helps put SPS Commerce’s journey in context. The 90 day share price return of 50.38% points to building momentum, yet the 1 year total shareholder return, down 22.29%, and 3 year total shareholder return, down 53.25%, show that a longer reset is still working through.
Scan how SPS Commerce compares to other software players showing sharp momentum and undergoing resets of their own with our curated 32 high quality undervalued stocks in the sector.
SPS Commerce has already staged a sharp rebound, yet the multiyear drawdown still hangs over the chart. Is the recent surge a late catch up, or has most of the easy upside already played out before valuation even enters the frame?
Most Popular Narrative: 13% Overvalued
The most followed valuation narrative pegs SPS Commerce fair value at $73.18, which sits below the last close of $82.68 and frames the recent rebound as pricing in a lot of the expected progress already.
The accelerating digitalization of retail supply chains and rising compliance requirements are driving demand for SPS Commerce's cloud-based EDI and supply chain solutions, supporting growth in new customer adds and recurring revenue. As the complexity of omni-channel retail and need for real-time, integrated supply chain analytics increases, SPS Commerce is positioned to expand its average revenue per user (ARPU) through expanded network connections and the cross-selling of products like analytics and revenue recovery solutions.
See why 4 investors see SPS Commerce as 13% overvalued.
Result: Fair Value of $73.18 (OVERVALUED)
Still, that story can change quickly if cautious U.S. supplier spending deepens or if recent acquisitions like Carbon6 and SupplyPike fail to deliver expected synergies.
Find out about the key risks to this SPS Commerce narrative.
Another View on SPS Commerce Valuation
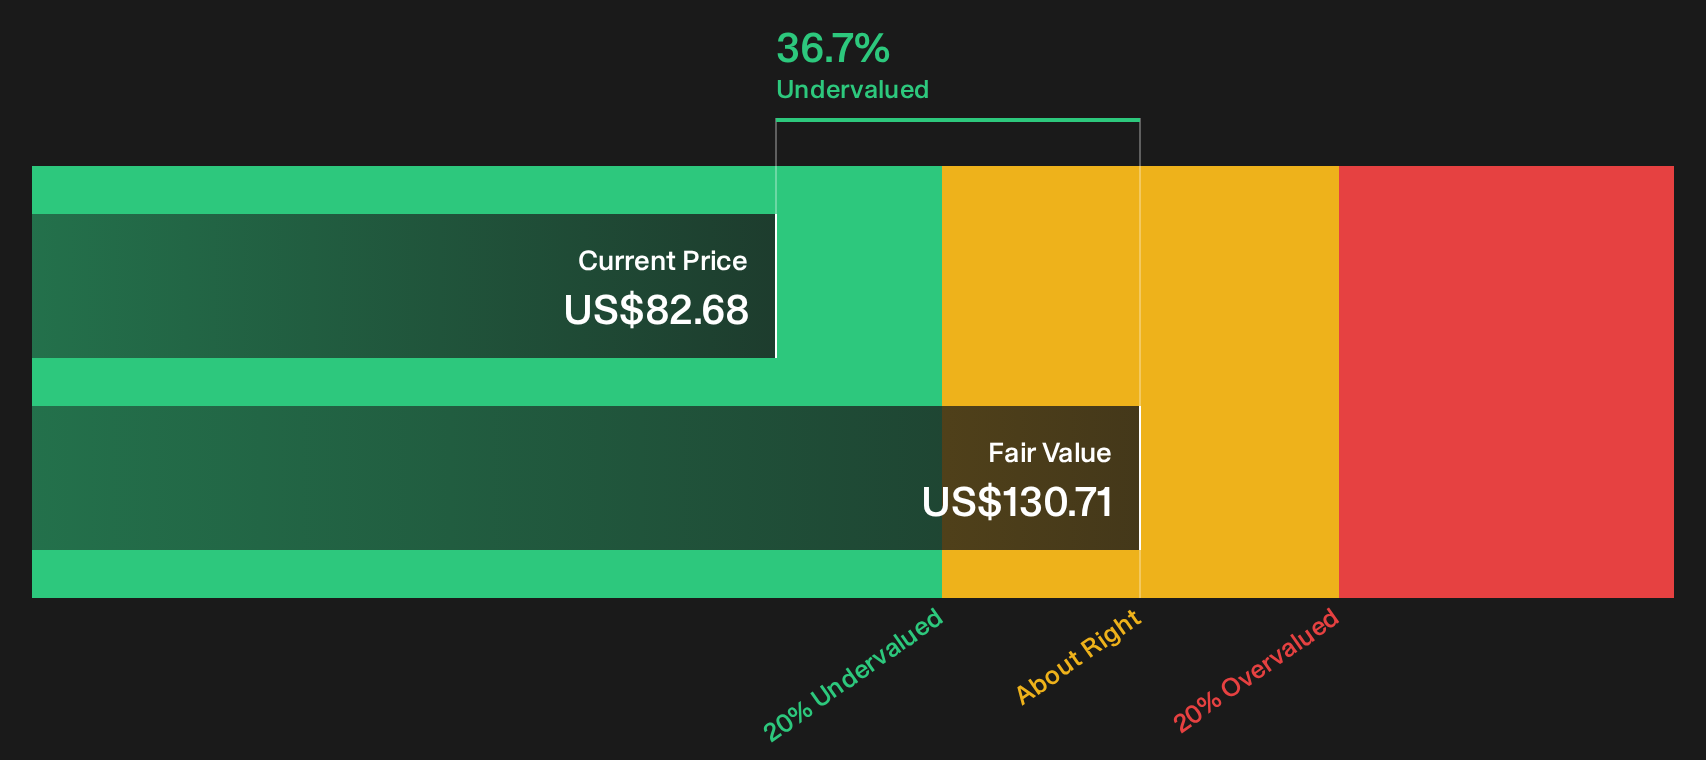
The analyst narrative frames SPS Commerce as 13% overvalued at $82.68 relative to a fair value of $73.18. A second lens tells a different story. Using the SWS DCF model, the stock trades at a 36.7% discount to an estimated future cash flow value of $130.71, which points to a very different risk reward profile. Which version you lean toward depends on how much weight you give to cash flow durability versus near term execution swings.
Look into the mechanics behind that cash flow driven estimate with the Look into how the SWS DCF model arrives at its fair value..
Next Steps
Opinions in this SPS Commerce story are mixed, and the clock is always ticking when sentiment and price are in flux. Check the underlying positives yourself and weigh them against your own risk tolerance by reviewing the 2 key rewards.
Looking for more SPS Commerce style investment ideas?
Do not stop your work with SPS Commerce alone. Use the screener to surface fresh opportunities that fit your style before other investors move first.
- Target income today by reviewing companies that appear in the 6 dividend fortresses.
- Hunt for potential mispricings by filtering through the 15 high quality undiscovered gems.
- Prioritise resilience and sleep easier at night by focusing on the 11 resilient stocks with low risk scores.
This article by Simply Wall St is general in nature. We provide commentary based on historical data and analyst forecasts only using an unbiased methodology and our articles are not intended to be financial advice. It does not constitute a recommendation to buy or sell any stock, and does not take account of your objectives, or your financial situation. We aim to bring you long-term focused analysis driven by fundamental data. Note that our analysis may not factor in the latest price-sensitive company announcements or qualitative material. Simply Wall St has no position in any stocks mentioned.
Have feedback on this article? Concerned about the content? Get in touch with us directly. Alternatively, email editorial-team@simplywallst.com