


- Tradeweb Markets reported August 2026 total trading volume of $61.2 trillion and average daily volume of $2.8 trillion, with ADV up 13.7% year over year.
- The sharp increase in average daily activity points to heavier client engagement on Tradeweb Markets' electronic platform, which can matter for future fee resilience and operating scale.
- This article examines how Tradeweb Markets' investment narrative intersects with August's 13.7% ADV rise and what that may signal for investors.
Scan how Tradeweb Markets' surge in August ADV compares with other electronic trading platforms by reviewing our curated list of 35 high quality undervalued stocks.
Tradeweb Markets Investment Narrative Recap
For a shareholder in Tradeweb Markets, the core belief is that more fixed income and derivatives trading will keep shifting onto electronic venues where its tools, data and connectivity already matter to large clients. The August ADV of $2.8tn, up 13.7% YoY, feeds into that thesis by showing stronger usage. The key short term catalyst is whether higher activity translates into sustained transaction revenue without eroding fee per million. The biggest near term risk is that volume growth concentrates in lower fee products, which would blunt the benefit of higher usage.
There is also the question of cost discipline. Tradeweb Markets is investing heavily in technology, global expansion and digital assets, which keeps operating expenses elevated. If activity stays strong but pricing pressure intensifies in areas like U.S. Treasuries or cash credit, margin expansion could stall. In contrast, if automation, data and post trade services see better adoption, the mix could tilt toward more recurring, higher margin lines. The August volume update is helpful for gauging demand, but by itself it does not materially change that basic risk reward setup.
Among recent datapoints, the clearest companion to the August release is the company’s reported earnings profile over the last year. Management has reported revenue of about US$2.2b and net income of roughly US$896.7m, with current net margin of 40.7% compared with 28.9% a year earlier. August’s US$61.2tn in trading volume slots into that context. It shows the trading engine still draws heavy flow at a time when analysts expect earnings to grow about 10.2% per year over the coming years.
For catalysts, that mix of solid profitability and higher ADV can matter for how you think about Tradeweb Markets’ ability to keep funding product build out, international coverage and data services without over stretching the cost base. The flip side is clear. If market share in key areas like U.S. Treasuries continues to slip or fee per million comes under more pressure, then even high monthly volumes like August’s may not fully offset pricing headwinds. The thesis now hinges on how effectively the platform converts activity into durable, fairly priced revenue while holding onto its position against rivals and direct connectivity alternatives.
What August’s ADV Spike Means Against Long Term Assumptions
Tradeweb Markets sits at an interesting intersection between punchy near term trading updates and a longer runway that equity analysts have already tried to map out in their models. The August print shows heavier usage of the platform. The consensus figures laid out alongside that update show what needs to happen over several years for that usage to support higher earnings and justify current expectations.
Analysts currently assume that Tradeweb Markets grows revenue by 10.4% a year over the next three years and that earnings rise from about US$896.7m today to about US$1.1b by 2029, which is roughly a US$200m step up in profit. On those estimates, revenues would reach about US$3.0b and earnings would be about US$1.1b in 2029, compared with a recent annual revenue figure of roughly US$2.2b and a 40.7% net margin that analysts expect to ease back toward 38.3%.
Uncover how Tradeweb Markets' fair value indicates a 19% potential upside to its current price that could narrow quickly if recent enthusiasm for Tradeweb Markets persists.
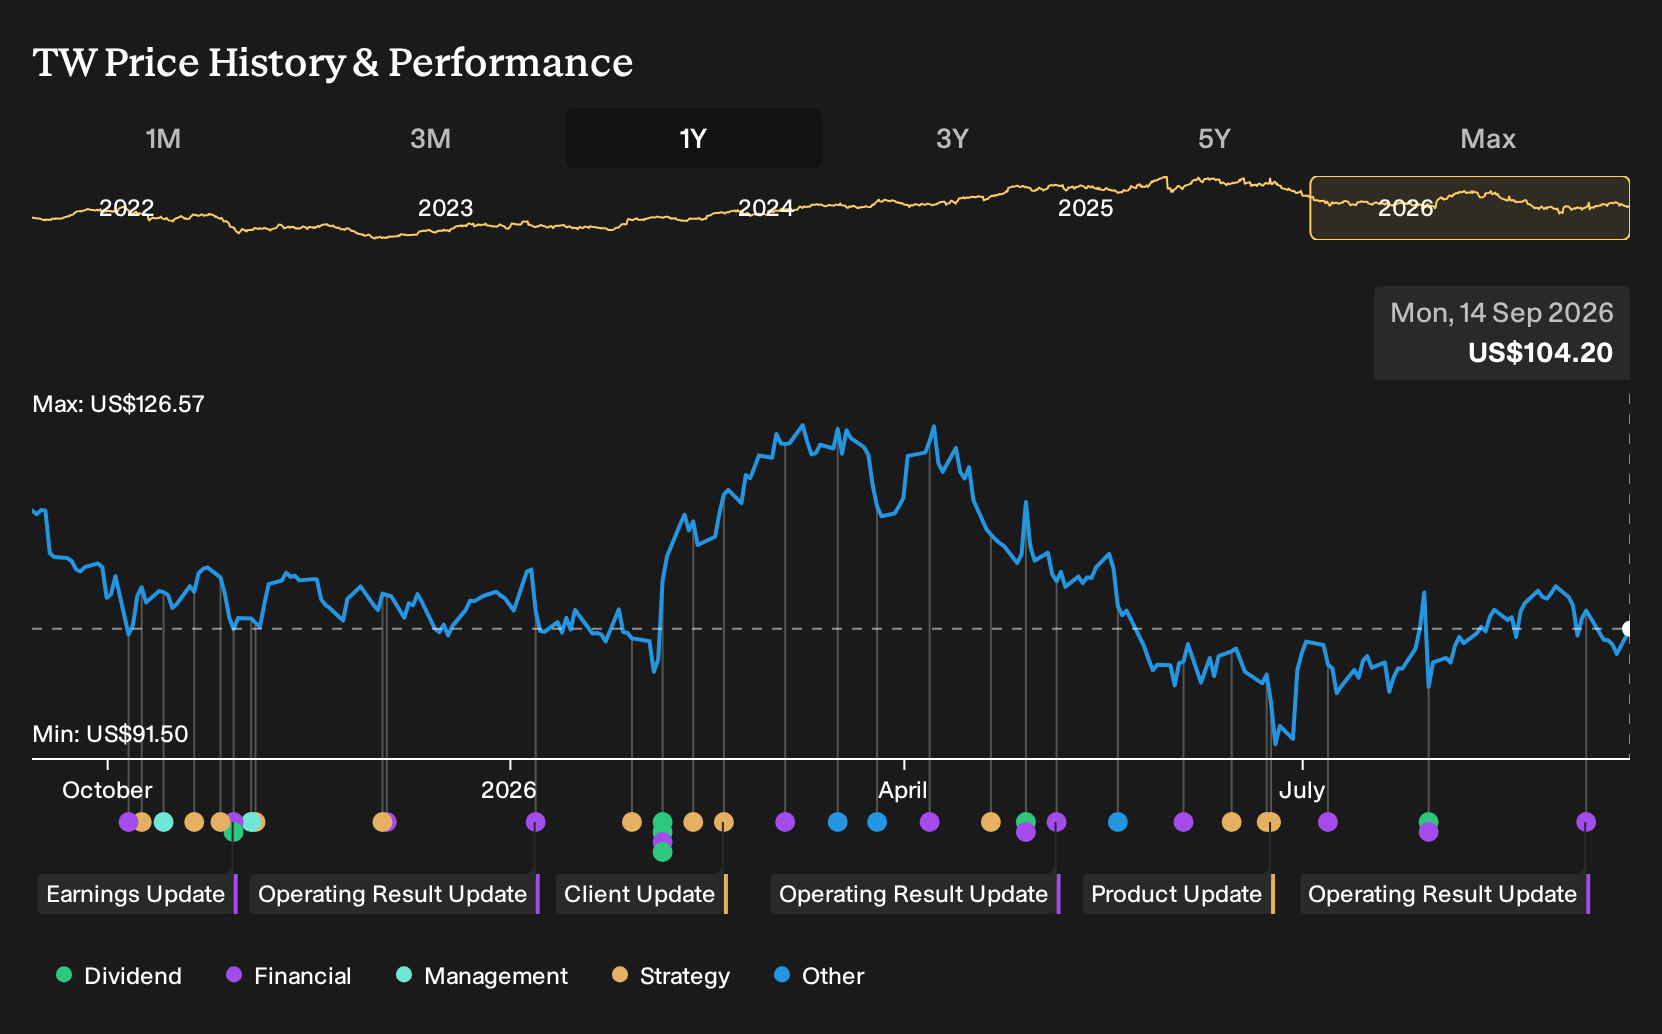
Exploring Other Perspectives
The most optimistic analysts focus on Tradeweb Markets’ potential for much faster revenue expansion if electronification in emerging markets accelerates. Before this August ADV jump, the bullish camp was pencilling in about US$3.3b of revenue and US$1.2b of earnings by 2029, compared with consensus closer to US$3.0b and US$1.1b. That gap shows how far opinions can stretch. Use this monthly volume surprise as a prompt to compare those competing forecasts and decide which story, if any, feels closer to your own view.
Explore 3 other Tradeweb Markets fair value estimates, including one that suggests potential upside of up to 59% from the current price.
The Verdict Is Yours
Don't just follow the ticker; dig into the data and build a conviction that's truly your own.
- A great starting point for your Tradeweb Markets research is our analysis highlighting 3 key rewards that could impact your investment decision.
- See our latest analysis for Tradeweb Markets. The report includes a comprehensive fundamental analysis summarized in a single visual, the Snowflake, making it easy to evaluate Tradeweb Markets' overall financial health at a glance.
Looking for more investment ideas beyond Tradeweb Markets?
Once the Tradeweb Markets story is clear in your mind, it can help to widen the lens and line it up against other opportunities using the Simply Wall St Screener.
- If capital preservation is high on your list, start by reviewing a 11 resilient stocks with low risk scores that may offer steadier profiles than a pure trading platform.
- For investors who care most about financial resilience, compare Tradeweb Markets with a list of solid balance sheet and fundamentals (23 results) and see how different balance sheets stack up.
- If you are hunting for potential mispricings, round out your watchlist with a 15 high quality undiscovered gems that could sit off most investors' radar today.
This article by Simply Wall St is general in nature. We provide commentary based on historical data and analyst forecasts only using an unbiased methodology and our articles are not intended to be financial advice. It does not constitute a recommendation to buy or sell any stock, and does not take account of your objectives, or your financial situation. We aim to bring you long-term focused analysis driven by fundamental data. Note that our analysis may not factor in the latest price-sensitive company announcements or qualitative material. Simply Wall St has no position in any stocks mentioned.
Have feedback on this article? Concerned about the content? Get in touch with us directly. Alternatively, email editorial-team@simplywallst.com