


Rakus (TSE:3923) has put a targeted corporate tweak on the table, asking shareholders to approve new business purposes that would allow entry into electronic payment services and financial service brokerage.
Recent trading shows a mixed picture for Rakus, with the share price at ¥1,086 after a 1-day share price return that slipped 1%. However, a 90-day share price return of 17.84% suggests momentum has been building ahead of the planned move into electronic payment and brokerage services.
Scan beyond Rakus and see how other potential payment and fintech platforms stack up by reviewing our hand picked 74 high quality undiscovered gems in this space.
Rakus now wants shareholder approval to step into payments and brokerage, yet the share price is still well below some valuation estimates. Does that shift the balance of risk and reward toward buyers, or has the easy upside already been taken?
Preferred P/E of 15.8x: Is it justified?
Rakus is being valued on a P/E of 15.8x, while the share price of ¥1,086 still reflects a sizeable discount to some valuation markers.
The P/E ratio compares what investors pay for each unit of earnings, which matters a lot for a software focused group like Rakus where profits, not assets, tend to drive the story. A 15.8x P/E against earnings that have been growing gives a clear snapshot of what the market is currently willing to pay for those profits.
That multiple looks inexpensive against several reference points. Company data flags that Rakus trades at good value versus its peers on P/E, where the peer average sits at 42.1x, and also against the broader JP Software industry average of 17.9x. In addition, the estimated fair P/E of 23x is materially higher than the current 15.8x level, which suggests the ratio could move closer to that fair level if sentiment aligns with the underlying earnings profile.
Explore the SWS fair ratio for Rakus.
Result: Price-to-earnings of 15.8x (UNDERVALUED)
Still, the narrative around Rakus can change quickly if the planned expansion into payments proves slower or more costly than expected, or if recent 1 year and 5 year total returns that declined unsettle longer term holders.
Find out about the key risks to this Rakus narrative.
Another view on Rakus through cash flows
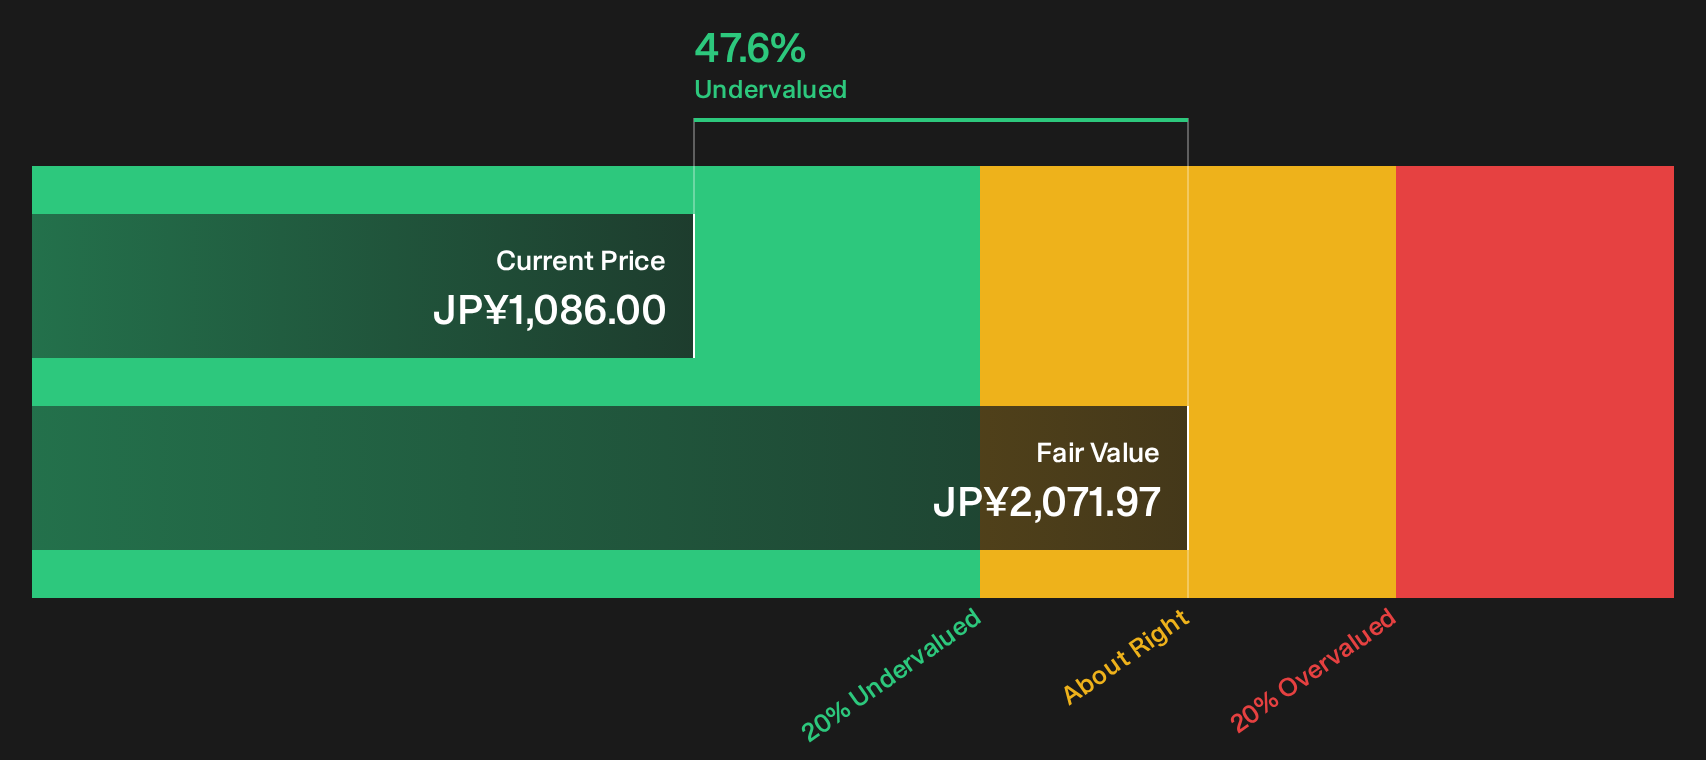
The P/E story points to value, but the SWS DCF model goes further. On this view, Rakus at ¥1,086 is trading below an estimated future cash flow value of ¥2,071.97. This signals undervaluation based on projected cash generation rather than current earnings multiples.
Both approaches lean in the same direction, yet they rest on very different assumptions about how consistently Rakus can convert its cloud services into long term cash. Which lens do you trust more when deciding how much valuation risk to take on this stock?
Look into how the SWS DCF model arrives at its fair value.
Simply Wall St performs a discounted cash flow (DCF) on every stock in the world every day (check out Rakus for example). We show the entire calculation in full. You can track the result in your watchlist or portfolio and be alerted when this changes, or use our stock screener to discover 18 high quality undervalued stocks. If you save a screener we even alert you when new companies match - so you never miss a potential opportunity.
Next Steps
Mixed signals around Rakus can feel confusing, so consider acting promptly, stress test the numbers against your own expectations, and weigh the balance of 4 key rewards and 2 important warning signs
Looking for more investment ideas beyond Rakus?
If Rakus has sharpened your appetite for opportunity, do not stop here. Broader research across clear themes can help you build a more resilient portfolio.
- Target potential value opportunities before the crowd by scanning our hand picked 18 high quality undervalued stocks that align strong fundamentals with appealing prices.
- Strengthen your income stream by reviewing a focused selection of high yield payers through the curated 17 dividend fortresses.
- Tilt your watchlist toward financial resilience by filtering companies with robust metrics using the purpose built list of solid balance sheet and fundamentals (19 results).
This article by Simply Wall St is general in nature. We provide commentary based on historical data and analyst forecasts only using an unbiased methodology and our articles are not intended to be financial advice. It does not constitute a recommendation to buy or sell any stock, and does not take account of your objectives, or your financial situation. We aim to bring you long-term focused analysis driven by fundamental data. Note that our analysis may not factor in the latest price-sensitive company announcements or qualitative material. Simply Wall St has no position in any stocks mentioned.
Have feedback on this article? Concerned about the content? Get in touch with us directly. Alternatively, email editorial-team@simplywallst.com