


BASF (XTRA:BAS) continues to draw attention after recent share price moves, with the stock closing at €51.81. Investors are weighing this level against the group’s broad chemicals, materials and agricultural solutions footprint.
Recent trading has been choppy, with BASF’s share price down 1.09% on the day and 3.47% over the past week, yet still showing a 15.70% year to date gain and a 23.75% total shareholder return over twelve months. This points to longer term momentum holding up better than very near term sentiment.
Scan BASF’s peers, which are seeing similar momentum and pressure points, by reviewing the hand picked 192 high quality undervalued stocks that share strong fundamentals and compressed expectations.
BASF now trades only slightly below the average analyst target, while a separate intrinsic value estimate implies a much wider gap. Which reference point better reflects where fair value truly sits?
Most Popular Narrative: 1% Undervalued
BASF’s most followed valuation storyline anchors fair value at about €52.55, only slightly above the latest close at €51.81. This keeps the gap tight but still meaningful for anyone watching entry levels.
Significant cost-savings programs (targeting €2.1 billion annual savings by end of 2026), alongside the completion of the major China Verbund investment (with project costs under budget and CapEx falling below depreciation from 2026), are expected to improve operating leverage and free cash flow, with cost competitiveness directly supporting improved net margins.
See why 104 investors see BASF as 1% undervalued.
Result: Fair Value of €52.55 (UNDERVALUED)
Still, the BASF narrative can be knocked off course if prolonged weak margins in basic chemicals persist, or if complex asset sales and the planned Agricultural Solutions IPO disappoint.
Find out about the key risks to this BASF narrative.
Another View: BASF Through The P/E Lens
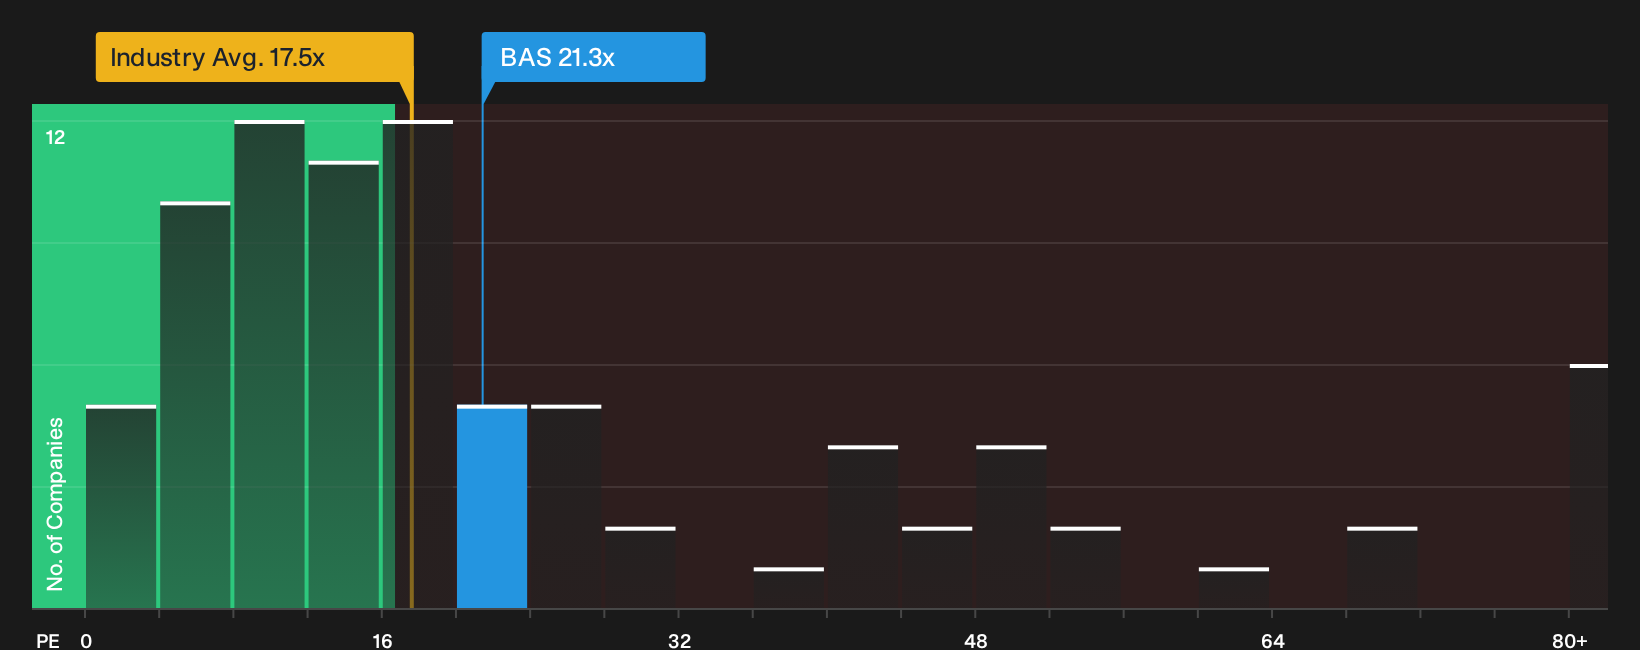
There is a very different picture if you look at BASF through its P/E ratio instead of intrinsic value models. The stock trades on 21.3x earnings, above the European chemicals average of 17.5x, yet below a fair ratio estimate of 23.2x that the market could move toward. This raises a simple question for investors: Is this a premium that limits upside or a valuation gap that could still close?
To understand how this earnings based yardstick lines up with BASF’s recent share price moves and analyst targets, see what the numbers say in our valuation breakdown, See what the numbers say about this price — find out in our valuation breakdown.
Next Steps
Mixed signals around BASF can feel confusing, so move fast and walk through the full picture yourself by weighing its 3 key rewards and 3 important warning signs.
Looking for more investment ideas beyond BASF?
If BASF has sharpened your focus on quality and price, do not stop here. Broaden your watchlist now so potential opportunities do not slip past unnoticed.
- Target stability first by reviewing a 102 resilient stocks with low risk scores that may help you focus on companies with more resilient profiles when markets turn choppy.
- Hunt for value by checking a 623 high quality undiscovered gems that could reveal financially sound businesses the broader market has not fully focused on yet.
- Prioritise financial strength by scanning a list of solid balance sheet and fundamentals (196 results) that highlights companies with sturdier foundations supporting their operations.
This article by Simply Wall St is general in nature. We provide commentary based on historical data and analyst forecasts only using an unbiased methodology and our articles are not intended to be financial advice. It does not constitute a recommendation to buy or sell any stock, and does not take account of your objectives, or your financial situation. We aim to bring you long-term focused analysis driven by fundamental data. Note that our analysis may not factor in the latest price-sensitive company announcements or qualitative material. Simply Wall St has no position in any stocks mentioned.
Have feedback on this article? Concerned about the content? Get in touch with us directly. Alternatively, email editorial-team@simplywallst.com