


Installed Building Products (IBP) surprised the market with a strong second quarter, topping analyst forecasts for revenue, EBITDA, and EPS. Yet the share price dropped after the report, putting that disconnect in focus for investors.
Installed Building Products is in a very different phase than a few years ago, with the recent earnings beat coming against a backdrop of weaker momentum. The share price is down 16.6% over the past month and 25.1% year to date, while the 5 year total shareholder return of 88.9% still points to a stronger longer term record.
Compare how Installed Building Products stacks up against other construction and home-installation peers that have also pulled back recently by scanning the 11 resilient stocks with low risk scores for potential opportunities with steadier profiles.
Installed Building Products now trades below both analyst targets and one estimate of fair value after a strong quarter. Is that a discount on quality, or a warning that the market’s caution on IBP still has teeth?
Most Popular Narrative: 18% Undervalued
Installed Building Products last closed at $200.30 while the most followed narrative estimates fair value at $244.82 using an 8.69% discount rate. That gap frames the recent selloff as a valuation mismatch rather than a simple reaction to one quarter of results.
Current strong cash flow from operations is mainly attributed to working capital improvements rather than fundamental growth in net income, which may not be sustainable. Any normalization in working capital could expose weaker core earnings and impact future cash flows.
See why 5 investors see Installed Building Products as 18% undervalued.
Result: Fair Value of $244.82 (UNDERVALUED)
Still, if Installed Building Products keeps expanding its commercial backlog or sustains recent margin resilience, the current undervaluation story could lose some of its impact.
Find out about the key risks to this Installed Building Products narrative.
Another View On Installed Building Products Valuation
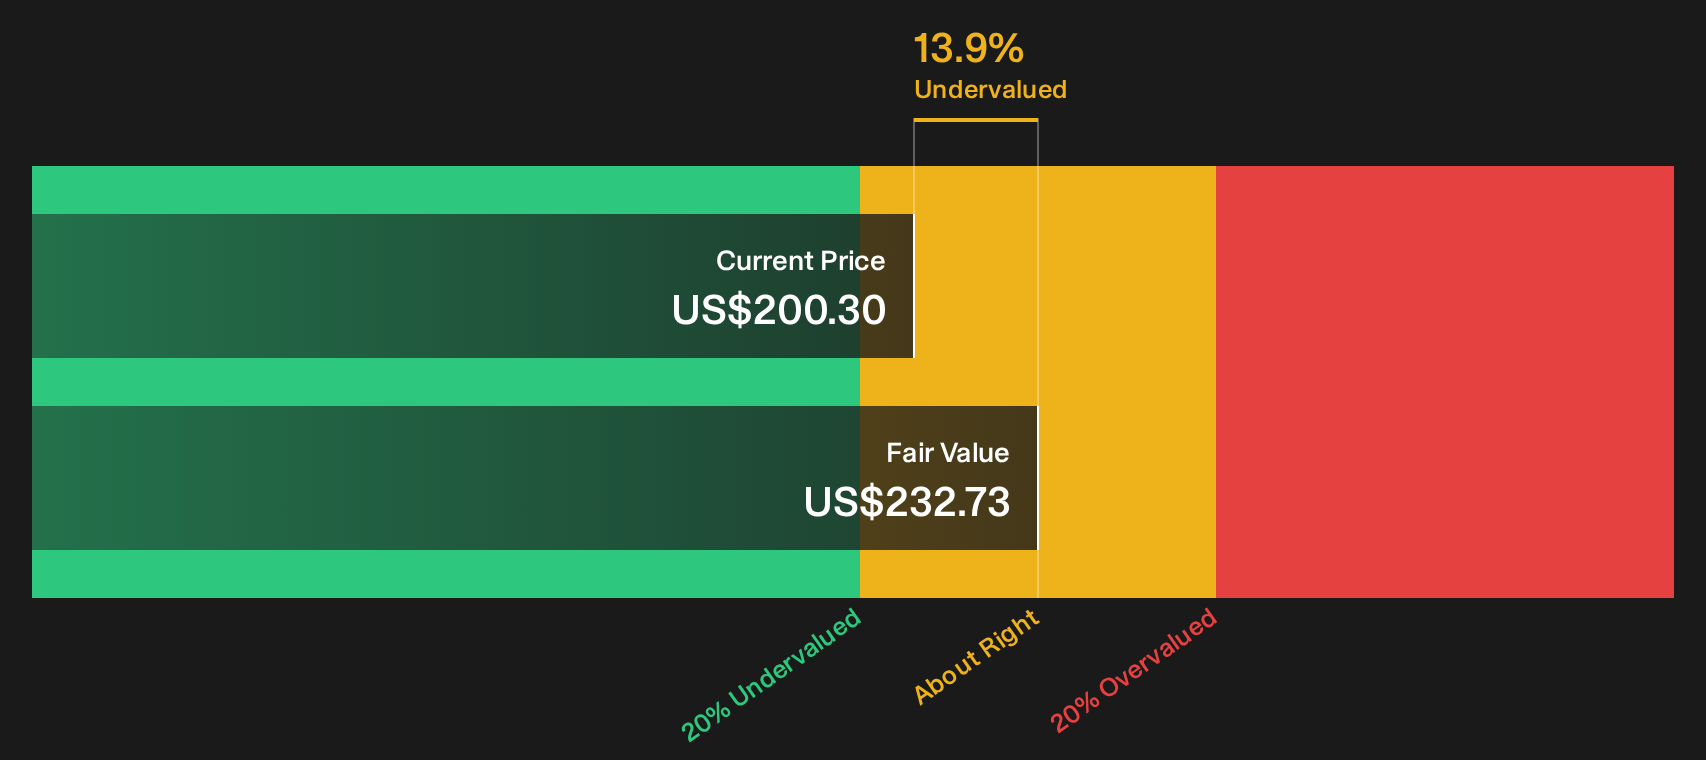
On a cash flow basis, the story shifts. The SWS DCF model estimates fair value for Installed Building Products at $232.73 per share, which is above the current $200.30 price. That still flags IBP as undervalued, although the gap is smaller than the narrative fair value of $244.82. Which signal do you trust more?
Look into how the SWS DCF model arrives at its fair value.
Next Steps
Mixed signals around Installed Building Products can feel confusing, so treat this as your prompt to move quickly, review the underlying data, and pressure test both the risks and the upsides for yourself with the 3 key rewards and 1 important warning sign.
Looking for more investment ideas beyond Installed Building Products?
If IBP has your attention, do not stop there. Broaden your watchlist now and give yourself more options before the next round of earnings reshuffles the field.
- Target resilient potential by scanning the 11 resilient stocks with low risk scores that can help keep your portfolio steadier when headlines turn noisy.
- Hunt for mispriced quality through the 15 high quality undiscovered gems that combine solid fundamentals with limited current attention from the crowd.
- Stack your income options by reviewing the 6 dividend fortresses that focus on higher yields with an emphasis on sustainability.
This article by Simply Wall St is general in nature. We provide commentary based on historical data and analyst forecasts only using an unbiased methodology and our articles are not intended to be financial advice. It does not constitute a recommendation to buy or sell any stock, and does not take account of your objectives, or your financial situation. We aim to bring you long-term focused analysis driven by fundamental data. Note that our analysis may not factor in the latest price-sensitive company announcements or qualitative material. Simply Wall St has no position in any stocks mentioned.
Have feedback on this article? Concerned about the content? Get in touch with us directly. Alternatively, email editorial-team@simplywallst.com