


Xencor (XNCR) heads to the 12th Annual Cantor Fitzgerald Global Healthcare Conference in New York on September 9, 2026, giving investors a fresh window into its antibody engineering pipeline and recent performance metrics.
Xencor’s recent share price performance has been volatile, with a 7 day share price return down 7.82%. However, the 90 day share price return of 101.07% and the 1 year total shareholder return of 188.93% point to strong momentum into the Cantor appearance.
Scan other antibody and biotech plays with similar momentum by checking out our hand picked 15 high quality undiscovered gems alongside Xencor, ahead of the Cantor conference.
Xencor now trades about 25% below the average analyst target after a sharp upswing, leaving a simple fork in the road. Is this caution healthy, or has the re-rating not gone far enough yet?
Most Popular Narrative: 14% Undervalued
At a last close of $24.53 against a widely followed fair value estimate of $28.50, the current Xencor share price sits at a clear narrative discount while analysts still anchor their work on long term pipeline execution and regulatory progress.
The robust and flexible XmAb platform allows for modular drug development and the creation of differentiated assets, expected to reduce development costs and timelines, directly benefiting future operating margins and net profitability.
See why 8 investors see Xencor as 14% undervalued.
Result: Fair Value of $28.50 (UNDERVALUED)
Still, Xencor faces very real risks if TL1A competition intensifies or if pivotal trials slip, which could weaken the current case that the stock is undervalued.
Find out about the key risks to this Xencor narrative.
Another View On Xencor’s Valuation
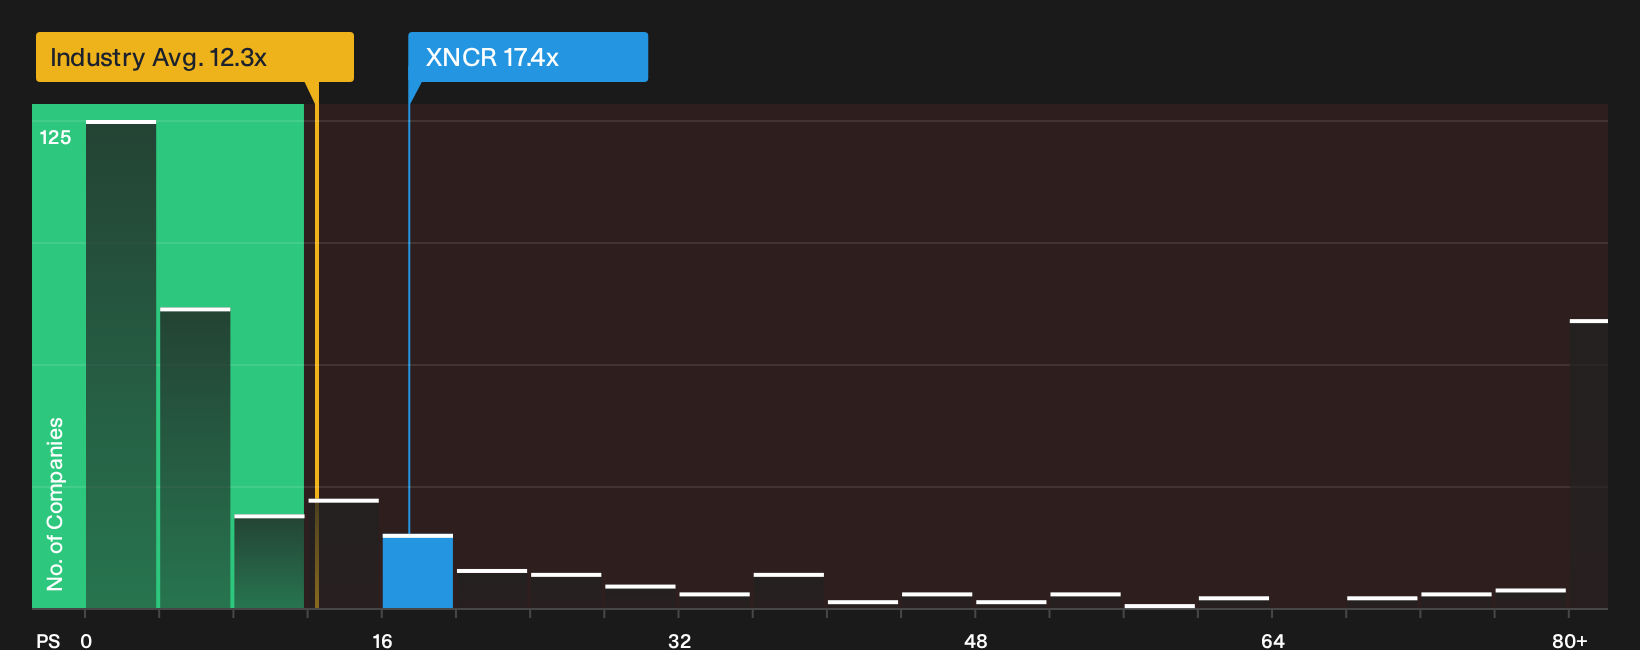
The fair value story for Xencor looks different once price is compared to sales instead of analyst targets. The stock trades on a P/S of 17.4x. That is higher than the US Biotechs industry on 12.3x and far above a fair ratio of 0.5x that the market could move toward over time.
Peers on average change hands around 26.8x sales, so Xencor sits between the broader sector and its closest comparison group. For anyone weighing the 14% undervalued narrative against a rich sales multiple, the real question is which reference point matters more for you.
See what the numbers say about this price — find out in our valuation breakdown.
Next Steps
Feeling pulled between Xencor’s upside story and the risks around execution and competition. Move quickly, examine the data, and weigh the 1 key reward and 1 important warning sign.
Looking for more Xencor-sized opportunities?
Do not stop with Xencor. Use the Simply Wall St Screener to quickly surface other ideas before the next wave of headlines leaves you reacting instead of prepared.
- Target companies with strong cash generation and quality fundamentals by reviewing the 35 high quality undervalued stocks that may not be fully reflected in current prices.
- Protect your downside by scanning the 11 resilient stocks with low risk scores that pair sturdier balance sheets with lower overall risk scores.
- Spot fresh opportunities before the crowd by filtering for the 15 high quality undiscovered gems that combine solid financials with lower visibility.
This article by Simply Wall St is general in nature. We provide commentary based on historical data and analyst forecasts only using an unbiased methodology and our articles are not intended to be financial advice. It does not constitute a recommendation to buy or sell any stock, and does not take account of your objectives, or your financial situation. We aim to bring you long-term focused analysis driven by fundamental data. Note that our analysis may not factor in the latest price-sensitive company announcements or qualitative material. Simply Wall St has no position in any stocks mentioned.
Have feedback on this article? Concerned about the content? Get in touch with us directly. Alternatively, email editorial-team@simplywallst.com