


- Kesko Oyj reported Group sales of €1,165.0 million for August 2026, a 5.4% increase year on year, with year to date sales reaching €8,841.3 million by the end of August.
- The sales update points to steady demand across Kesko Oyj’s operations, giving investors fresh data on how current trading conditions are feeding through to topline performance.
- This article examines how Kesko Oyj’s investment narrative is influenced by August’s 5.4% sales growth and the year to date performance.
Scan how Kesko Oyj’s August trading update compares with other retailers showing resilient top line momentum by reviewing the hand picked list of solid balance sheet and fundamentals (194 results).
What Is Kesko Oyj's Investment Narrative?
To own Kesko Oyj, you really need to buy into a fairly simple idea. This is a multi segment retailer that lives or dies on execution in grocery, building supplies and car distribution, and on how efficiently it turns heavy working capital and store networks into cash. The August sales figures, €1,165.0 million for the month and €8,841.3 million year to date, suggest demand is holding up and give some support to near term revenue expectations rather than rewriting them.
The more interesting piece for you as a shareholder is how that trading update interacts with current catalysts and weak spots. Management is working with modest forecast revenue and earnings expansion, a P/E that screens slightly expensive against peers, and a balance sheet flagged for high debt and a patchy dividend record. Fresh monthly sales momentum helps the short term story around operating performance, but it does not on its own change the bigger questions around leverage, capital intensity and how much of Kesko Oyj’s future cash flow is already in the price.
Yet there is a single pressure point that could matter more than the latest 5.4% sales uptick if...
There's only one way to know the right time to buy, sell or hold Kesko Oyj. Head to Simply Wall St's company report for the latest analysis of Kesko Oyj's Fair Value.
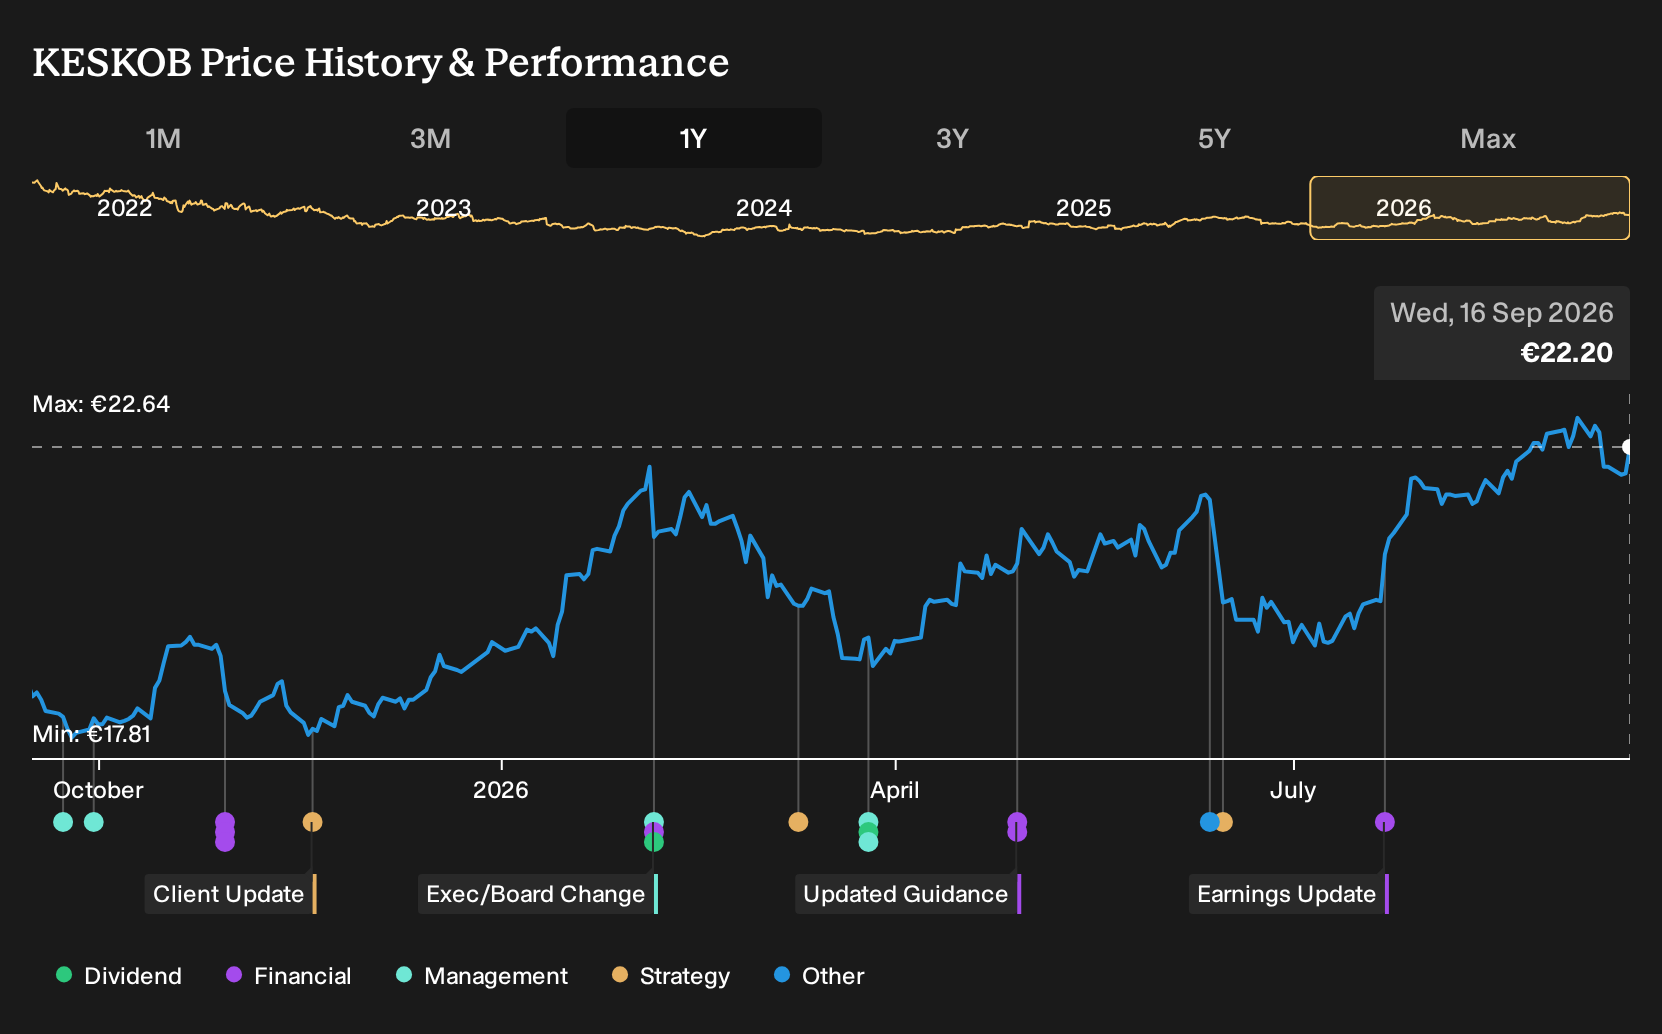
Exploring Other Perspectives
Four fair value estimates from the Simply Wall St Community span a wide band, from €16.26 at the low end to about €47.15 at the top. That gap shows how differently private investors are framing Kesko Oyj after the August trading update. Treat this as a prompt to compare several viewpoints before leaning on any single number.
Explore 3 other Kesko Oyj fair value estimates, including one that suggests as much as 27% downside from the current price!
Reach Your Own Conclusion
Disagree with this assessment? Extraordinary investment returns rarely come from following the herd, so go with your instincts.
- A great starting point for your Kesko Oyj research is our analysis highlighting 3 key rewards and 2 important warning signs that could impact your investment decision.
- See our latest analysis for Kesko Oyj. The report includes a comprehensive fundamental analysis summarized in a single visual, the Snowflake, making it easy to evaluate Kesko Oyj's overall financial health at a glance.
Looking For More Investment Ideas Beyond Kesko Oyj?
If Kesko Oyj sits on your watchlist, it can help to compare its profile with other businesses that offer different mixes of quality, income and risk. The Simply Wall St Screener lets you scan for stocks that fit those themes in a few clicks, so you can build a watchlist that matches how you actually like to invest.
- If you want potential upside with companies that screen as both strong and inexpensive, start by reviewing 189 high quality undervalued stocks that combine quality fundamentals with a discounted share price.
- If dependable income matters more to you than short term share price moves, focus on yield by checking out 161 dividend fortresses that emphasise higher payouts supported by solid financials.
- If capital protection is your first filter before thinking about returns, narrow the universe to 104 resilient stocks with low risk scores that show more resilient balance sheets and lower overall risk scores.
This article by Simply Wall St is general in nature. We provide commentary based on historical data and analyst forecasts only using an unbiased methodology and our articles are not intended to be financial advice. It does not constitute a recommendation to buy or sell any stock, and does not take account of your objectives, or your financial situation. We aim to bring you long-term focused analysis driven by fundamental data. Note that our analysis may not factor in the latest price-sensitive company announcements or qualitative material. Simply Wall St has no position in any stocks mentioned.
Have feedback on this article? Concerned about the content? Get in touch with us directly. Alternatively, email editorial-team@simplywallst.com