


GDS Holdings (NasdaqGM:GDS) has been drawing fresh attention after reporting record bookings of 470 megawatts in the first half of 2026, tied to rising demand for computing power and AI infrastructure in China.
Despite the record bookings story, GDS Holdings’ share price tells a more cautious tale. The stock is down 14.16% on a 1-month share price basis and 20.79% year to date, while the 3-year total shareholder return of 188.41% contrasts sharply with a 24.34% decline over the past year. This suggests earlier enthusiasm has cooled and investors are now reassessing how much growth and risk they are prepared to price in at the current US$30.37 level.
Compare GDS Holdings with other AI infrastructure plays by scanning our hand picked 60 AI infrastructure stocks while this demand for computing power is in the spotlight.
GDS Holdings now trades at US$30.37 while analyst targets sit far higher, which raises a simple question: Is the market rightly cautious, or is the gap to fair value too wide to ignore?
Most Popular Narrative: 41% Undervalued
The most followed narrative puts GDS Holdings’ fair value at $51.62, well above the recent $30.37 close. This frames the current drop as a potential disconnect between near term worries and longer term AI data center optionality.
The successful implementation of China's first data center ABS and C-REIT IPOs has pioneered a pathway for GDS to repeatedly recycle capital at cap rates (and multiples) well above the company's own market valuation. This allows the company to fund new growth while improving leverage and enhancing ROIC, supporting stronger net earnings over time.
See why 13 investors see GDS Holdings as 41% undervalued.
Result: Fair Value of $51.62 (UNDERVALUED)
Still, this upbeat GDS Holdings story leans heavily on ongoing asset sales and high leverage, so any funding squeeze or refinancing stress could quickly challenge it.
Find out about the key risks to this GDS Holdings narrative.
Another View on GDS Holdings Valuation
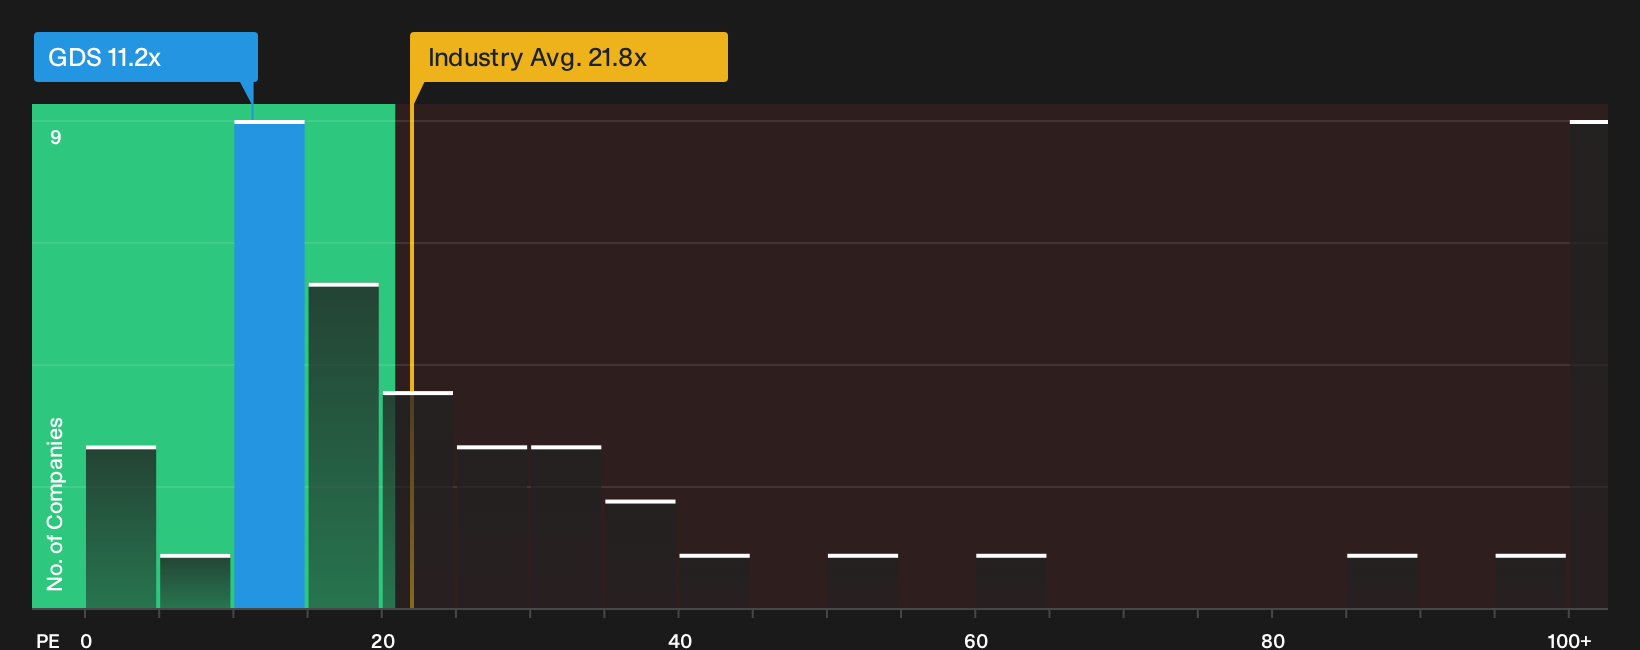
A second lens uses GDS Holdings' P/E ratio of 11.2x against an estimated fair ratio of 9.9x, the US IT industry at 22.3x, and peers at 36x. That mix points to cheaper pricing than sector rivals but a premium to the fair ratio. Is that discount compensation or extra risk?
See what the numbers say about this price gap and how it could close over time in our valuation breakdown, starting with the See what the numbers say about this price — find out in our valuation breakdown..
For a side by side view of how GDS trades against the wider IT sector on earnings, check the latest comparison in
Next Steps
Sentiment on GDS Holdings is clearly split, which is exactly why it makes sense to review the data yourself and move quickly while the market is unsure. To weigh both sides of the story, start with the 3 key rewards and 2 important warning signs.
Looking for more investment ideas beyond GDS Holdings?
Do not stop your research at one stock. Use the screener to surface fresh ideas quickly so you are not reacting after the market has already moved.
- Target resilient income by focusing on companies with higher yields and stronger payout support through the 6 dividend fortresses.
- Spot potential mispricing opportunities early by scanning the 33 high quality undervalued stocks before others catch on.
- Prioritise peace of mind by filtering for sturdier finances using the list of solid balance sheet and fundamentals (22 results).
This article by Simply Wall St is general in nature. We provide commentary based on historical data and analyst forecasts only using an unbiased methodology and our articles are not intended to be financial advice. It does not constitute a recommendation to buy or sell any stock, and does not take account of your objectives, or your financial situation. We aim to bring you long-term focused analysis driven by fundamental data. Note that our analysis may not factor in the latest price-sensitive company announcements or qualitative material. Simply Wall St has no position in any stocks mentioned.
Have feedback on this article? Concerned about the content? Get in touch with us directly. Alternatively, email editorial-team@simplywallst.com