


- Royal Gold reported record first half 2026 revenue of $917 million, with a 128% year over year jump supported by higher metal prices and new output from the Kansanshi, Sandstorm, and Horizon assets, which together doubled the number of revenue producing assets.
- The expanded streaming and royalty portfolio, now covering a broader mix of gold and copper projects, strengthens Royal Gold’s production base and gives management more levers to balance mine specific issues or commodity swings across a larger set of cash flowing assets.
- This article examines how Royal Gold’s investment narrative is influenced by record first half revenue and the doubled portfolio footprint.
Review how Royal Gold's record first half sets the bar for precious metal streamers, then evaluate the rest of the field with our curated 36 elite gold producer stocks
Royal Gold Investment Narrative Recap
For Royal Gold, the core belief is that a wider mix of streams and royalties can translate into steadier cash generation even when individual mines hit issues. The record first half and contributions from Kansanshi, Sandstorm, and Horizon support that diversification story. In the near term, the key swing factor is how reliably those expanded assets turn contracted volumes into actual deliveries.
The largest risk right now sits with concentration in gold prices and execution across a few heavyweight mines that have previously underperformed. Record revenue on its own does not change that. It does, however, give management more flexibility to absorb short term hiccups, provided integration of the new assets and higher leverage are handled cleanly.
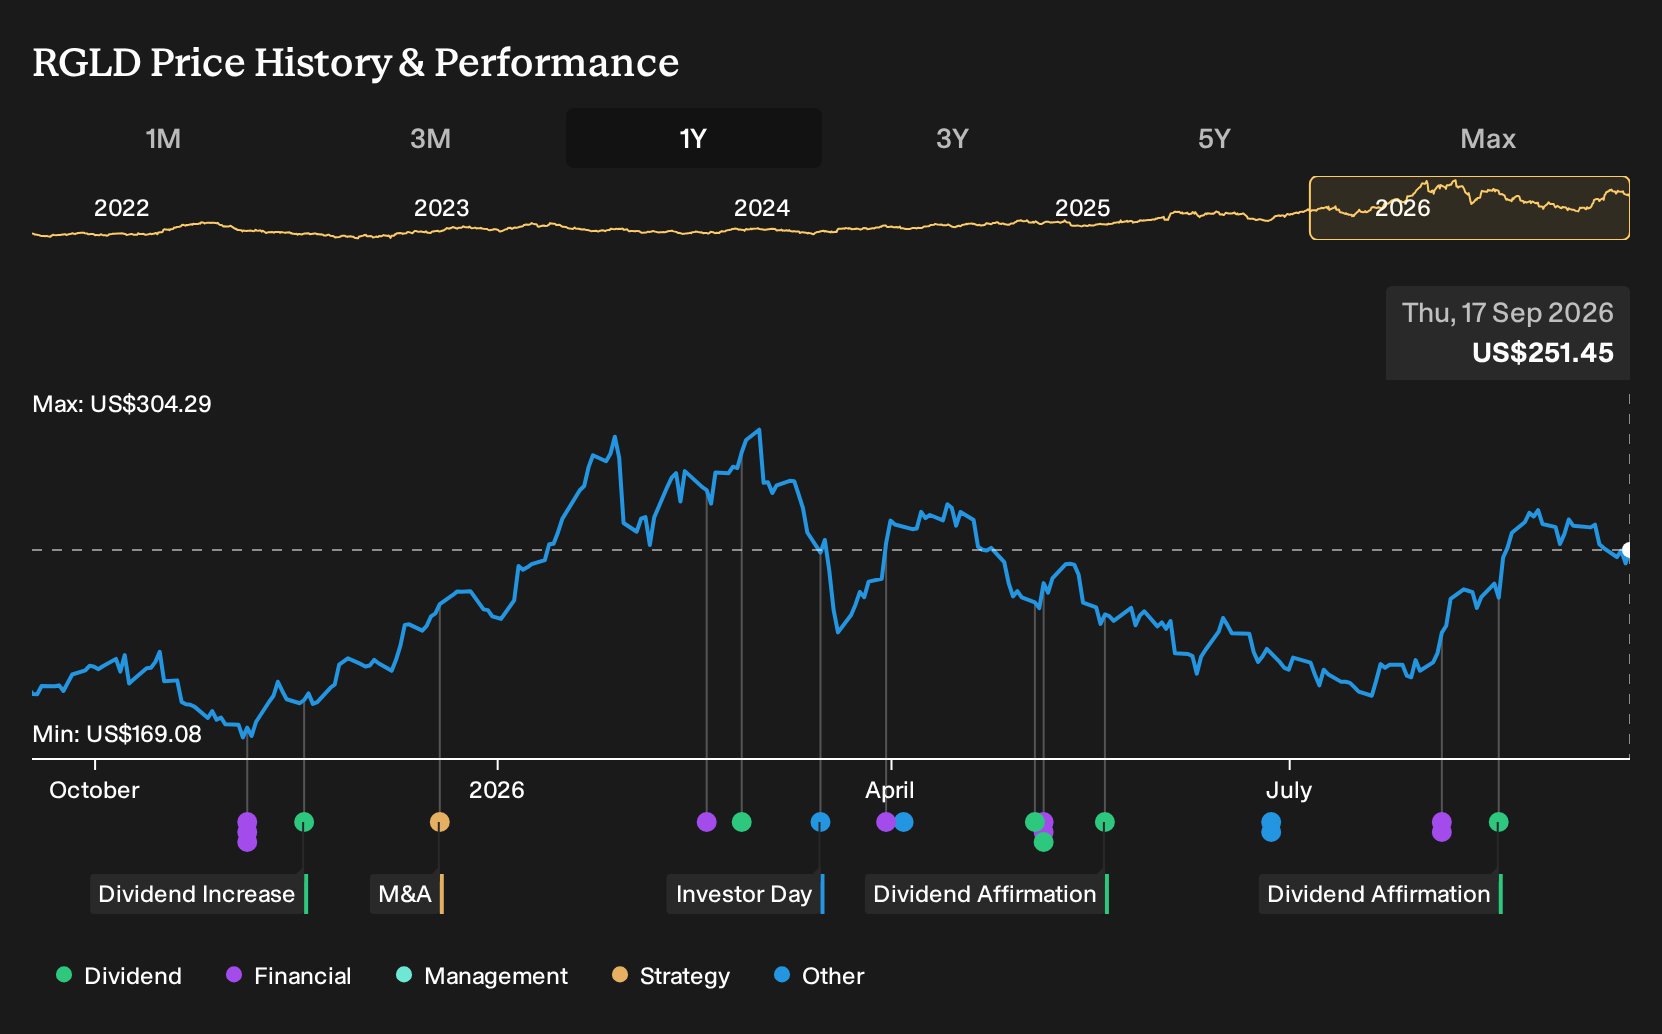
The virtual non deal roadshow on 17 September puts Royal Gold’s recent performance and portfolio expansion under a spotlight with investors. Management has an opportunity to explain how record first half revenue interacts with prior concerns about mine level underperformance, geopolitical exposure, and the use of the revolving credit facility to fund acquisitions.
Analysts see the stock as trading near a premium P/E versus both peers and the broader Metals and Mining group, which tightens the room for disappointment if growth or margins stall. That makes execution messaging on Sandstorm, Horizon, and Kansanshi crucial. You are essentially watching whether the expanded streaming platform can offset asset specific volatility while carrying higher debt and still support the long term growth story.
What The Royal Gold Forecasts Are Asking You To Believe
Royal Gold's narrative projects US$2.5b revenue and US$1.3b earnings by 2029. This assumes 24.0% yearly revenue growth and an earnings increase of about US$666m from US$633.9m today.
The story analysts are sketching is ambitious. Royal Gold is expected to move from a little over US$600m of earnings today to US$1.3b within a few years, while lifting margins from 48.9% to 52.4%. That is a material shift in profitability, not just a gentle upgrade to the current business mix.
For this to line up, the model effectively asks you to underwrite two things. First, that revenue can climb to US$2.5b by 2029 at that 24.0% annual clip. Second, that the richer margin profile actually shows up in delivered earnings rather than staying on a slide deck.
The gap between earnings today and the 2029 consensus also matters for how you think about valuation. At a current P/E of 26.9x, analysts are pencilling in Royal Gold at 31.5x on those future earnings, which is higher than the 17.3x figure quoted for the wider US Metals and Mining group. The thesis here is that a broader streaming platform with higher margins can support a premium multiple.
On price targets, the spread is wide enough to signal genuine disagreement. The consensus sits at US$305.67 per share, with the high case at US$375.0 and the low at US$209.0. With the stock around US$201.26, that average target is 34.2% above the current quote, but the bearish end of the range says there is room for disappointment if the revenue or earnings path falls short.
Royal Gold's enlarged footprint after Sandstorm, Horizon, and Kansanshi gives some context for these numbers. Analysts are effectively assuming that the bigger set of royalties and streams can pull through into stronger free cash flow, fund further deals, and still support higher earnings per share even as the share count itself is expected to grow around 7.0% per year for the next three years.
The key tension is straightforward for investors. If revenue does reach US$2.5b and earnings land around US$1.3b in 2029, then the premium P/E and current target range look internally consistent with the models. If growth, margins, or asset performance land below those marks, the multiple and the targets start to look demanding rather than justified.
Uncover why Royal Gold's fair value indicates a 22% potential upside to its current price that could narrow quickly.
Exploring Other Perspectives
One alternate Royal Gold angle puts copper exposure at the center of the story. Bullish analysts were already sketching about US$2.7b of 2029 revenue and US$1.3b of earnings before this record first half, leaning on projects like Kansanshi S3 and Red Chris. That is a far more optimistic path, and it shows how widely views can spread. Use this roadshow and the fresh numbers as a chance to compare those upbeat copper heavy assumptions with more cautious gold focused models, then decide which camp you find more convincing.
Explore 3 other Royal Gold fair value estimates, including one that suggests as much as 39% upside from the current price.
Decide For Yourself
Don't just follow the ticker. Dig into the data and build a conviction that's truly your own.
- A great starting point for your Royal Gold research is our analysis highlighting 3 key rewards and 1 important warning sign that could impact your investment decision.
- See our latest analysis for Royal Gold. The report includes a comprehensive fundamental analysis summarized in a single visual, the Snowflake, making it easy to evaluate Royal Gold's overall financial health at a glance.
Looking For More Ideas Beyond Royal Gold?
Once you have a view on Royal Gold, it can help to widen the lens and compare it with other opportunities that fit different risk and income profiles using the Simply Wall St Screener.
- If you want potential mispricing plus quality, start with a curated pool of companies trading below estimated value using our 29 high quality undervalued stocks.
- For investors who care most about durable balance sheets and resilient fundamentals, narrow your search with the list of solid balance sheet and fundamentals (23 results).
- If you are hunting for underfollowed ideas with strong business traits, broaden your watchlist through the 16 high quality undiscovered gems.
This article by Simply Wall St is general in nature. We provide commentary based on historical data and analyst forecasts only using an unbiased methodology and our articles are not intended to be financial advice. It does not constitute a recommendation to buy or sell any stock, and does not take account of your objectives, or your financial situation. We aim to bring you long-term focused analysis driven by fundamental data. Note that our analysis may not factor in the latest price-sensitive company announcements or qualitative material. Simply Wall St has no position in any stocks mentioned.
Have feedback on this article? Concerned about the content? Get in touch with us directly. Alternatively, email editorial-team@simplywallst.com