


The Zhitong Finance App learned that the “Flows & Liquidity” global capital trend research report recently released by J.P. Morgan Chase shows that the impact on bond supply caused by the expansion of technology financing can still be actively absorbed. The cooling of stock market purchases in September is also more likely to be a phased halt rather than an established warning sign of a capital withdrawal trend. J.P. Morgan's quantitative model still shows that the probability of the S&P 500 index rising in the next six months is very high.
Furthermore, the breakdown of the agency's capital flow and global investment dynamics shows that the inflow intensity of ETFs in the US materials, industry, and energy industries in the past 12 months is unexpectedly ahead of the technology sector; the global AI semiconductor weather vane index with extremely high investment popularity in the Asian market — that is, the South Korean and Taiwan stock market ETFs recently received strong inflows, but the weight of the US is still significantly lower than that of global stock indices, while the US weight is biased towards “neutral.” Corporate net debt issuance remains positive, while net stock issuance is still negative. This statistic shows that while increasing debt financing, the corporate sector is also reducing net stock supply through capital activities such as repurchases.
According to information, the J.P. Morgan Chase model calculation data shows that the net issuance of US and European technology corporate bonds in 2026 is expected to increase by about 260 billion US dollars compared to 2025, compared to its previously predicted net issuance of about 4.9 trillion US dollars of global bonds, an increase of about 5.3%; according to the supply and demand model, the upward impact on the yield of the Global Aggregate Index (Global Agg for short) is only about 10-15 basis points, or 0.10-0.15 percentage points. After adding the expected variables of policy interest rates, it is estimated The impact was further reduced to 5-10 basis points. J.P. Morgan Chase's estimates of the impact of technology debt issuance can be described as much more optimistic than the negative expectations that the market had expected of about 5 percentage points.
Meanwhile, equity fund inflows are close to zero after five consecutive months of strong growth, but J.P. Morgan's senior analyst team tends to believe that this weakness may be as brief as April 2024; some European treasury bond momentum signals have entered extreme regions, which may trigger a profit settlement; both gold and Bitcoin are funded, and Bitcoin's higher hedging positions may provide more room for subsequent recovery. J.P. Morgan said that the latest global capital flow data highlights “changes between supply pressure, marginal capital flows, and stock positions” that are currently worth paying attention to.
Dismantling the “Global Tech Bonds Frenzy”: How the $260 billion increase is transmitted to the global bond yield curve
J.P. Morgan predicts that the net issuance of investment-grade and high-yield bonds in the US technology industry will increase from about 140 billion US dollars in 2025 to about 335 billion US dollars in 2026, totaling about 200 billion US dollars compared to the year-on-year incremental massage J.P. Research report; the total annualized progress of European technology bonds issued this year exceeds 90 billion euros, up from 35 billion euros in 2025. The bank assumes that the vast majority of these additions are net supply. The bank estimates that the increase of about 55 billion euros, equivalent to 60 billion US dollars in net issuance between the US and Europe .
To measure the risk of the interest rate/yield curve, the J.P. Morgan analyst team multiplied the bond stock by “index longevity ÷ corresponding 10-year treasury bond maturity” and converted it to 10-year equivalent (10-Year Equivalents): the share of US corporate bonds in the total long-term increase of corporate bonds and treasury bonds rose from less than 10% in 2025 to about 40% in 2026, and US Treasury bonds still account for about 60%; the corresponding share of corporate bonds in the euro market fell from about 40% to 20%. The overall net supply of US high-grade corporate bonds covering various industries is expected to increase from 615 billion US dollars to close to 1 trillion US dollars. The issuance of long-term bonds by hyperscale cloud vendors is an important reason for the increase in the long-term supply of corporate bonds.
On this basis, J.P. Morgan used the historical relationship between annual “excess supply,” that is, changes in supply and demand reduction, and changes in Global Agg yield to calculate the impact of 10-15 basis points; after adding the 6-month annual change in overnight index swap (OIS) interest rates, the impact fell to 5-10 basis points, but since policy interest rates also affect bond supply and demand, the two explanatory variables are not completely independent. Ultimately, it still uses 10-15 basis points as J.P. Morgan's main conclusion.
Therefore, analysts at J.P. Morgan Chase unanimously emphasized that the research report supports “the supply of new technology causes moderate and acceptable marginal pressure”, rather than “AI financing will not affect the US bond yield pricing curve,” nor does it use this figure as the upper limit of the increase in US 10-year Treasury yields; its estimates mainly target bond issuance, and are not calculated by combining the effects of all bank loans, private credit, or AI productivity expectations.
Stock buying: “putting on the brakes” in September, why it may become one of the best reverse signals of the year
J.P. Morgan Chase's interpretation of September's stock fund flow is positive, based on the fact that the popularity of capital and retail transactions has cooled down, and that the fundamentals or long-term allocation logic have proven to be ineffective. Global equity fund-related flows observed at the time of publication of the report — including mutual funds, ETFs, and leveraged ETF capital inflows and rebalancing transactions — fell close to zero after five consecutive months of strong growth.
Since retail purchases made by retail investors through stock funds increased markedly in the fourth quarter of 2023, a similar situation previously only occurred in April 2024. At that time, it was also accompanied by rising policy interest rate expectations and bond yields, but capital inflows were strong again in May. The net opening purchase index for small individual bullish options and the performance of retail investors' preferred stock basket compared to S&P 500 are also at a low level, so the bank tends to think that weak capital will not last long, which is the so-called “fake decline” of capital flow.
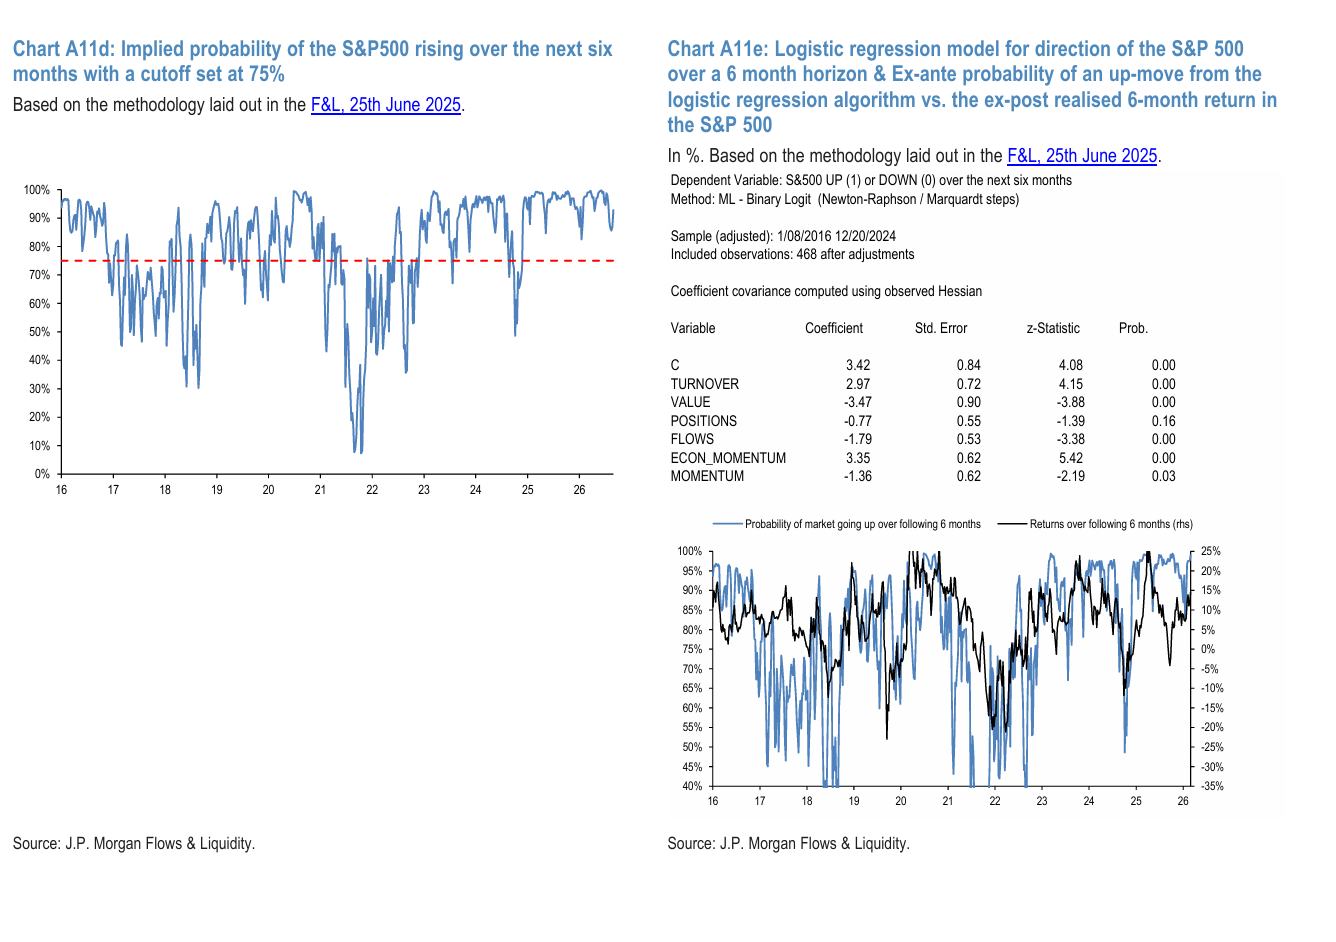
J.P. Morgan's quantitative model also provides an important support: a logistic regression model that combines transaction activity, valuation, positions, capital flow, economic momentum, and price momentum. Its latest graphical position is still above the 75% judgment threshold for the probability that the S&P 500 index will rise in the next six months. However, this is a directional probabilistic model, and a 75% increase is not expected. Within the framework of this model, “over 75%” can be understood as a strong bullish signal, and the more accurate statement is “the model estimates that the probability that the S&P 500 will rise in the next six months is high.” The curve is above this threshold, meaning that the model estimates that the index level after six months is more than 75% more likely than the predicted starting point.
Furthermore, according to data compiled by J.P. Morgan Chase, the comprehensive stock position as of September 15 is still at the 75th percentile in history, government bonds are at the 55th percentile, and credit bonds are at the 21st percentile; global non-bank investors account for about 50% of the stock allocation, about 28% of cash, about 18% to 19% of bonds, and about 3% of commodities containing private gold; therefore, the more complete signal is that “the trend of new increases has receded, and the stock allocation is still high. This also provides a critical observation clue for the resumption of buying.
Regional rotation, corporate repurchases, and long-term institutional undertakings coexist
According to J.P. Morgan Chase's capital flow dynamic data, capital is still being allocated across regions and credit ratings, and enterprises and long-term institutions also continue to participate in the market. Home According to the average weekly data for the four weeks ended September 9, the net inflow of global equity funds was US$7.2 billion and the net inflow of bond funds was US$8.9 billion; the net outflow of US equity funds was US$2.6 billion, while the net inflow of non-US equity funds was US$9.7 billion; the net inflow of US high-yield bond funds was US$600 million; and the net inflow of European money market funds was US$8.5 billion. There is an inclusive relationship between these categories, which reflect the differentiation between regions and asset quality, and cannot be added together item by item.
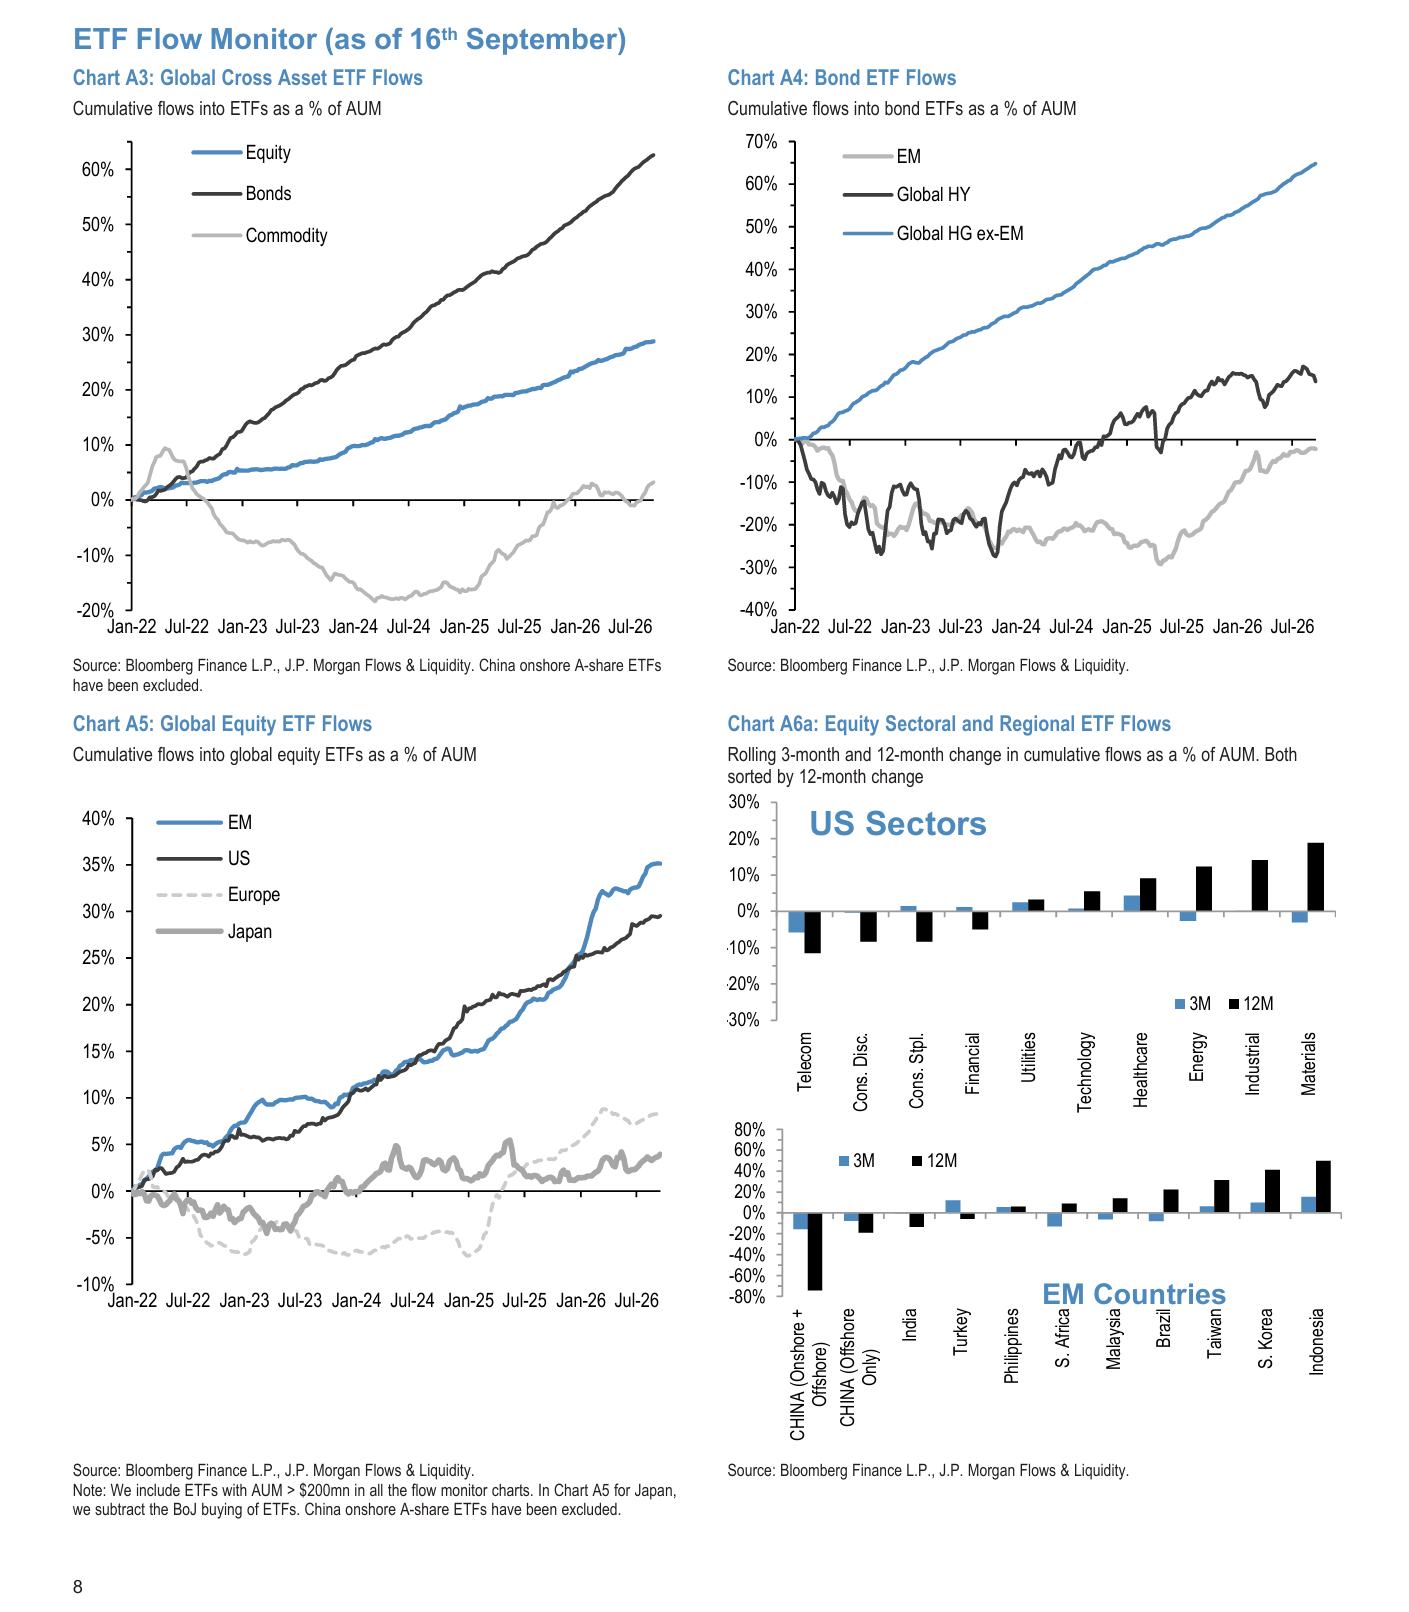
ETF monitoring further showed that the inflow intensity of ETFs in the US materials, industry, and energy industries in the past 12 months was unexpectedly ahead of technology; although ETFs in the Korean stock market and Taiwan stock market received strong inflows, they are still about 0.6 and 0.5 percentage points lower than the global stock index weight, Japan is about 1.2 percentage points lower, Europe is about 1.6 percentage points overallocated, and US positions are “neutral”, which is enough to show that “capital inflows” and “relatively low allocations” can coexist.
On the corporate side, in the first quarter of 2026, the G4 Economic Union — the United States, the United Kingdom, Eurozone, and Japan — the overall cash flow of non-financial companies represented a higher share of GDP than capital expenditure. Net debt issuance remained positive and net stock issuance was negative; as of August, the world had announced repurchases estimated at about 1.3 trillion US dollars, of which the US was about 1 trillion US dollars. This is the announced amount rather than the implemented amount.
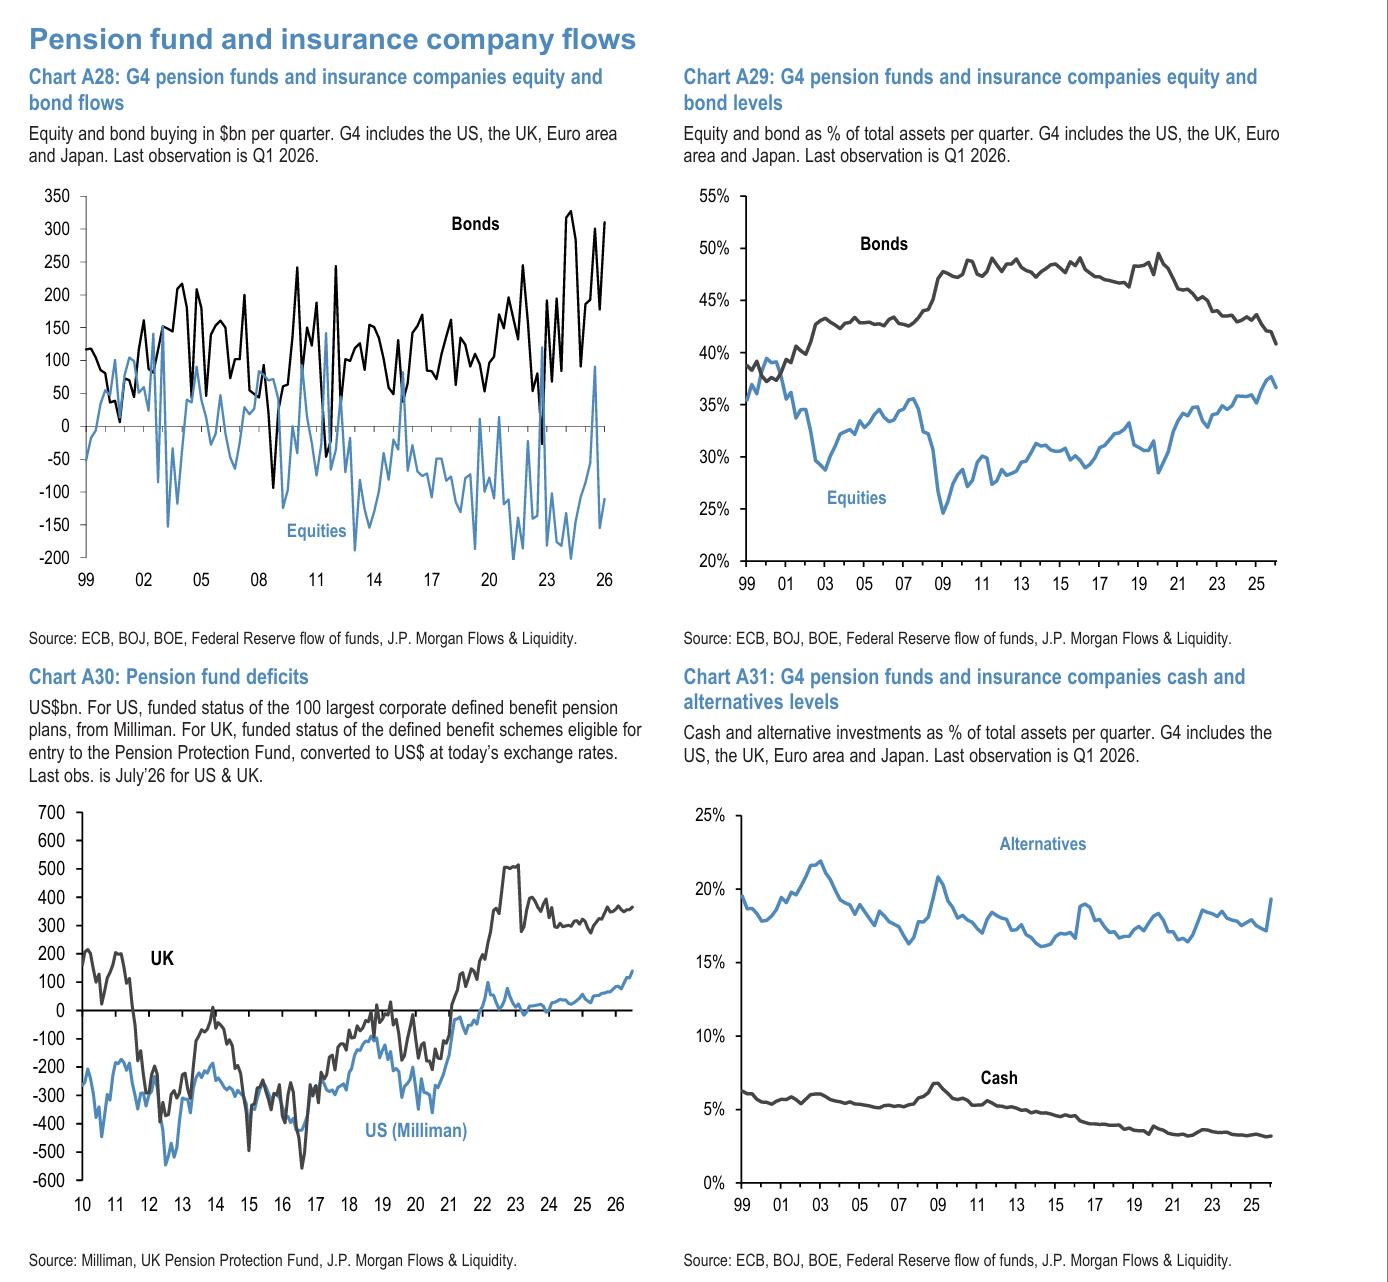
G4 pensions and insurance companies are still making net purchases of bonds. As of July, the US and UK pension samples were in a state of capital surplus; credit creation in the US, Japan, and the Eurozone remained positive. As of September 4, the year-to-date announced scale of global IPOs, subsequent stock issuances, and mergers and acquisitions increased 167%, 45%, and 35%, respectively. J.P. Morgan said that these data together show that corporate financing, repurchases, and long-term institutional debt purchases are still in operation.
CTA led trend and hedging: bond market momentum is extreme, and stocks have yet to fully enter panic pricing
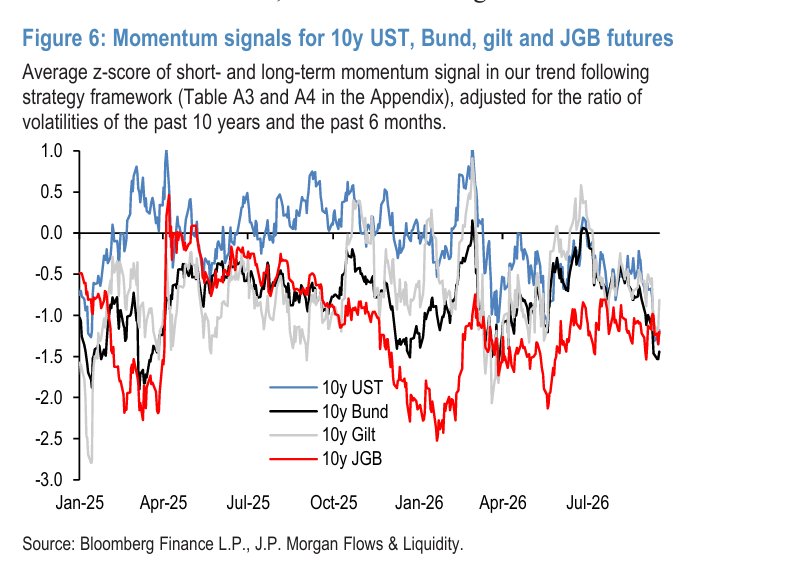
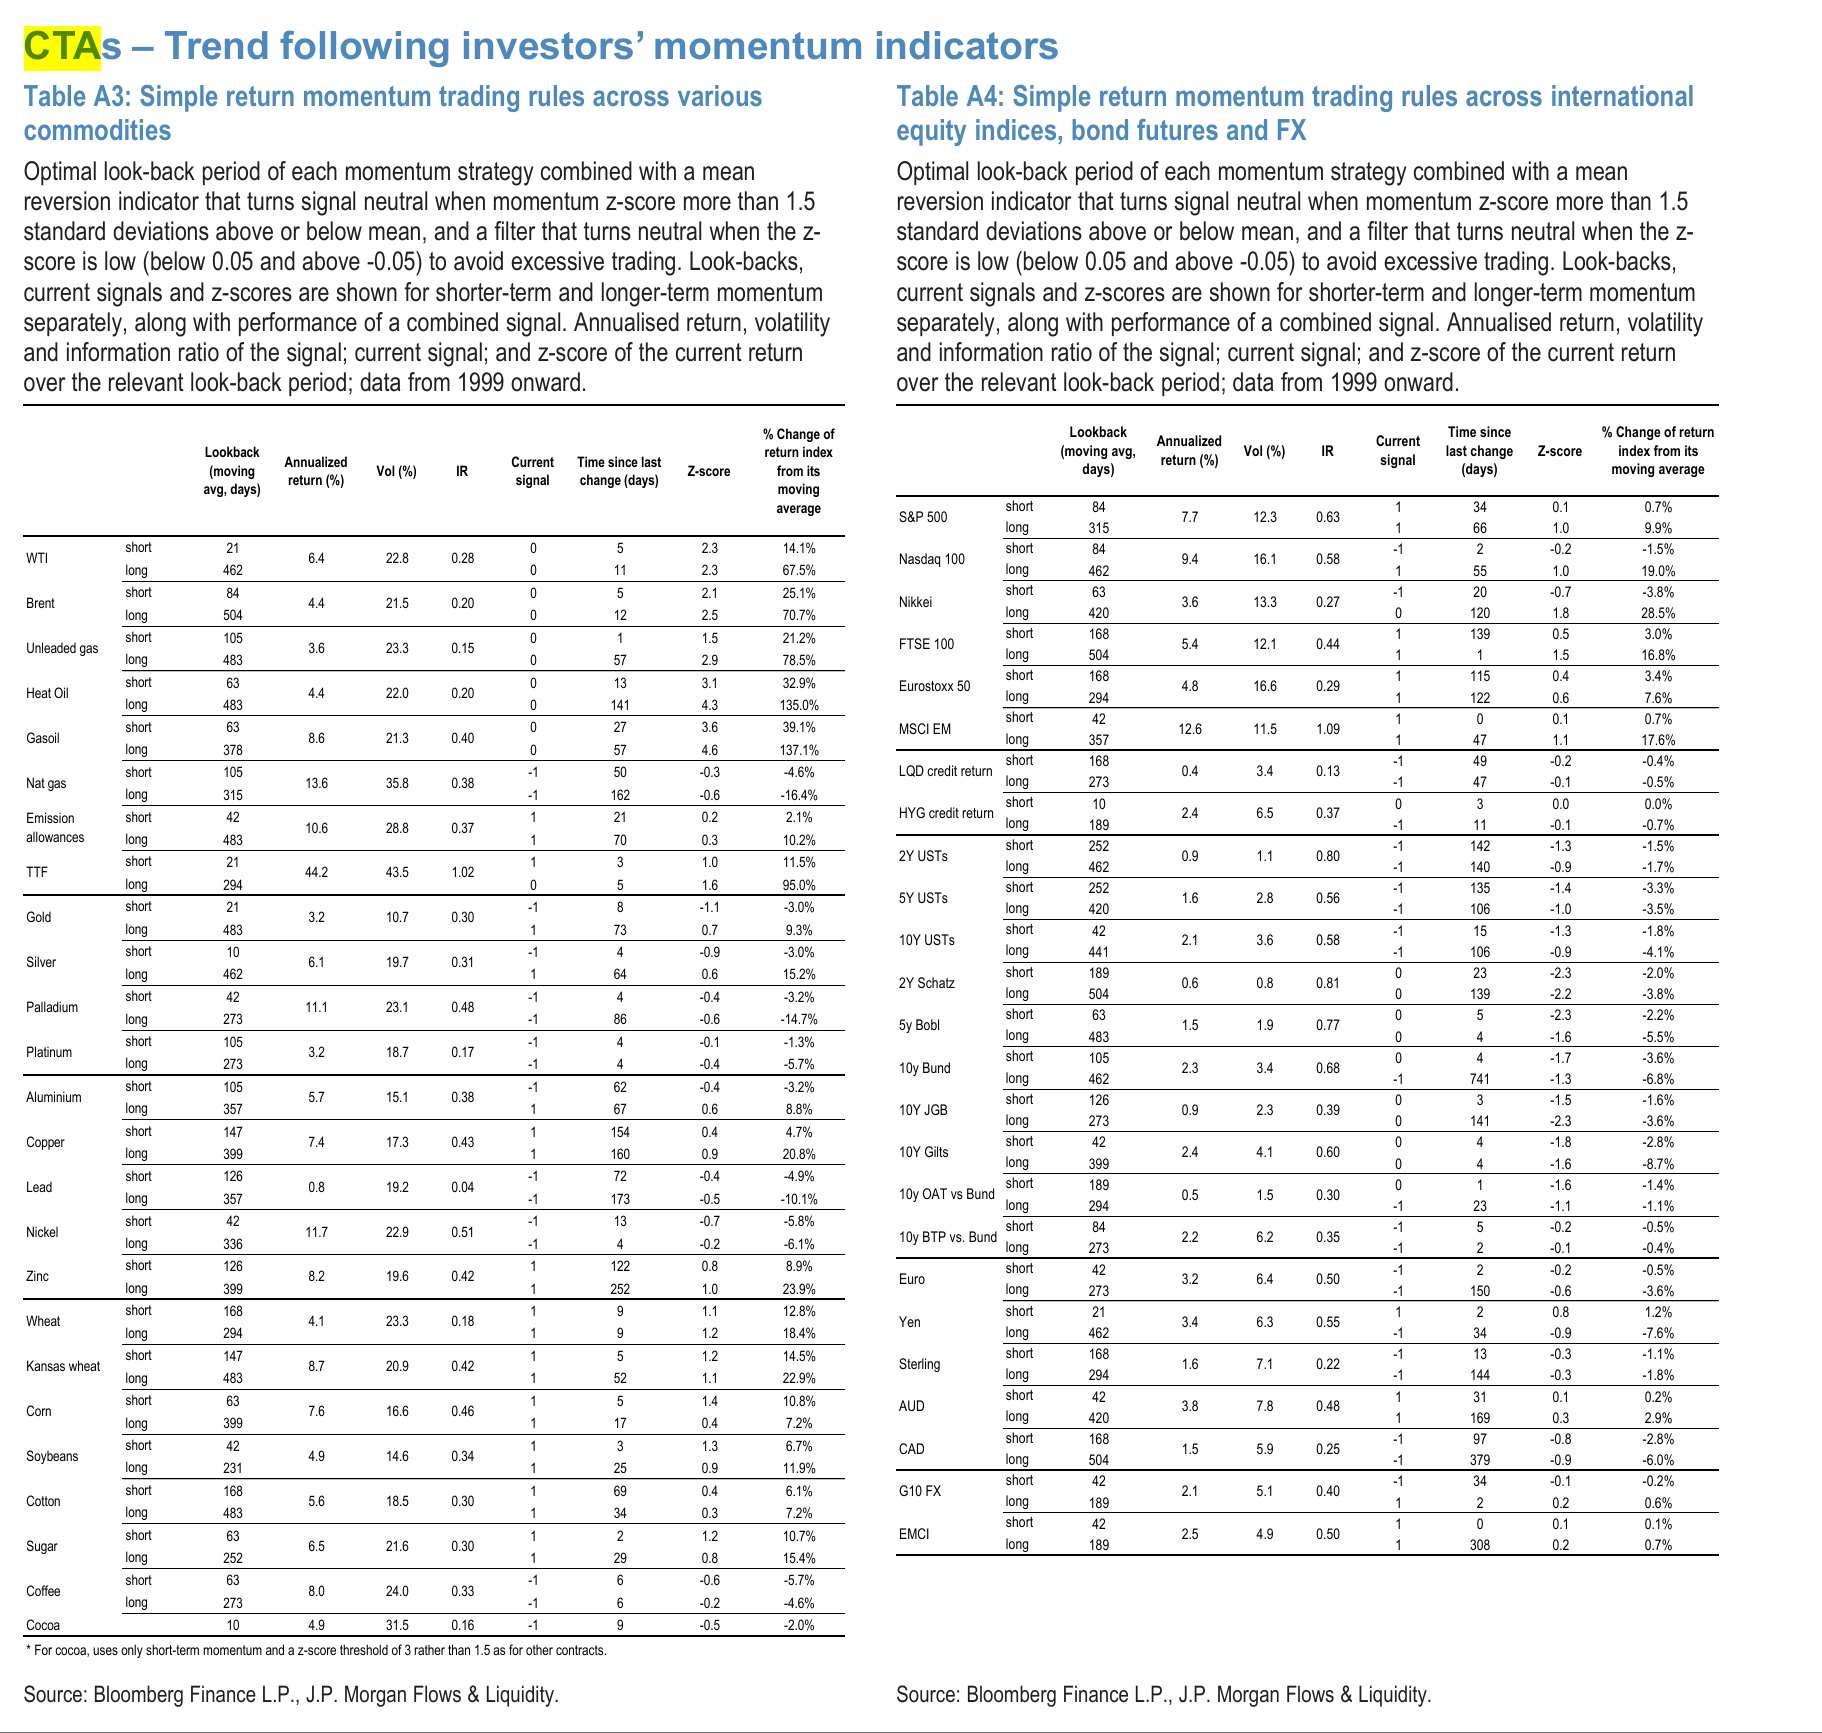
The most notable change in CTA signals related to the quantitative strategy with the title of “fast money” is an area where the downward trend in some bonds is close to triggering a return to average and profit settlement. The short- and long-term average momentum standard score for German 10-year treasury bond futures was once below “-1.5” and returned to about -1.4 at the time of reporting; US and Japanese 10-year treasury bonds returned to -1.2, and the UK went from about -1.2 to -0.8; the futures momentum signal for French 10-year treasury bonds compared to German treasury bonds reached -1.6 on September 15, and was still around -1.5 at the time of reporting. J.P. Morgan Chase's trend framework sets a mean regression filter. When the signal exceeds the threshold of plus or minus 1.5, it may turn neutral. Therefore, these are technical clues to potential position reduction and profit settlement, not statistics on all CTA's actual short positions.
On the stock side, the average momentum signals for the S&P 500, European Stoxx 50, Nikkei, and MSCI emerging markets are still at +0.4 to +0.8, not reaching the extreme level of earlier this year; in the page 17 rule model, the S&P 500 is long in the short and long term, while the NASDAQ 100 is short and long term. WTI and Brent have become neutral due to excessive momentum, and gold and silver also showed a long short period of time. Hedging and institutional indicators are also inconsistent: as of September 15, the implied volatility of the S&P 500 three-month average was 15%, close to a one-year low of 14%, while Brent reached 52%; SPY and QQQ short selling ratios were still lower than the high levels in earlier years, and the technology industry's short selling standard score was close to neutral, and essential consumption, utilities, and industries were more prominent compared to history.
The beta of active US bond funds on the composite bond index was close to 1.0. The stock beta of US balanced funds declined, but the stock beta of risk parity funds was still higher than the long-term average; as of September 15, CTA, risk parity fund samples, and the US stock/US debt 60/40 portfolio rose 9.4%, 7.3%, and 6.7% respectively during the year. During the same period, MSCI global stocks rose 12.4%, and the global composite bond index fell 0.8%.
Basically, these data show that high interest rate pressure is driving strategic differentiation, rather than the simultaneous withdrawal of all capital; similarly, active transactions are not equal to net inflows — in the report's transaction monitoring, the year-to-date nominal turnover of emerging and developed market stocks increased 129% and 43%, respectively, over the same period last year, which can occur at the same time as the slowdown in purchases of new funds in September.
It is worth noting that the signal nature data compiled above is not CTA's actual position statistics, but rather a “direction signal that CTA/momentum capital may take” simulated by the Morgan General Trend Following (Trend Following) rule model. The model records the signals as +1 = long, -1 = short, and 0 = neutral, and calculates short-term and long-term review windows separately; therefore, as of the latest model state reported on September 16, 2026, the S&P 500 is a short-term long+long-term long, with a review period of 84 days and 315 days, respectively; the NASDAQ 100 is a short-term short+long-term long, with a review period of 84 days and 462 days, respectively.
More specifically, the S&P 500 short-term bullish signal has been maintained for about 34 days, and the long-term bullish signal for about 66 days; the NASDAQ 100 short-term short signal was transferred about 2 days ago, while the long-term bulls have been maintained for about 55 days. Therefore, it more accurately reflects that the J.P. Morgan Chase model determines that CTA trend funding is currently still “shorter+long” for S&P, while for NASDAQ it is “short + long.”
Gold and Bitcoin: The trend of capital flows back to gold is stronger, and potential positions to make up “digital gold” Bitcoin is more dominant
Since the end of July, gold ETFs have completely recovered their previous capital outflows, while ETF funds related to Bitcoin linked to the title of “digital gold” have recovered only about half; however, IBIT's short ratio is still close to the high level during the year, significantly higher than GLD, so if demand for hedging falls in the future, Bitcoin may receive stronger marginal recovery support.
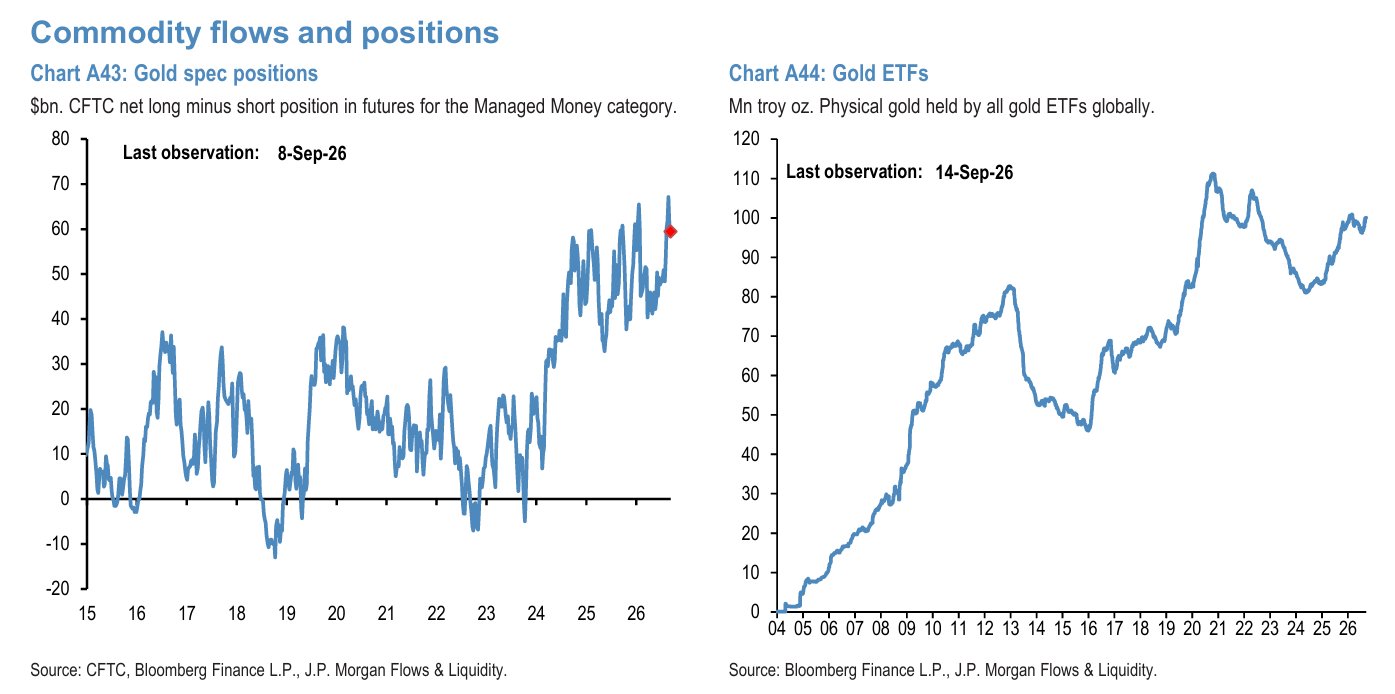
Both are attracting gold, but J.P. Morgan values Bitcoin's untapped position repair space more. Since the end of July, both gold and Bitcoin ETFs have received significant inflows. Gold ETFs have completely recovered their previous outflows during the year. Bitcoin ETFs have only recovered about half, and recently there has been a slight rebound; the bank believes that under the conditions of improved news, there is still room for further normalization of Bitcoin ETF demand. Both futures position agency indicators are also at a high level, indicating that institutional capital also participated in the “Debasement Trade” (Debasement Trade), and the recent rise in actual bond yields caused this transaction to retreat somewhat.
The key difference is not that gold has no financial support, but that Bitcoin still holds more cautious or protective positions: IBIT's short selling ratio is close to the high level during the year, while GLD is below the historical average; IBIT's bearish/call options open volume ratio is also higher than GLD. Therefore, if hedging demand falls, the relevant position adjustments may provide stronger marginal support for Bitcoin than gold. After short-term capital cools down, opportunities are more likely to come from renewed demand, excessive trend trading adjustments, and hedging position recovery.