


The latest catalyst for Kyowa Kirin (TSE:4151) is the release of topline data from its Phase 2 study of KHK4951 in patients with neovascular age-related macular degeneration, which is prompting fresh attention on the pipeline and valuation.
Set against this clinical update, Kyowa Kirin’s share price closed at ¥2,265.5, with a 7 day share price return of 3.38%, but a weaker 30 day share price return, which declined 12.51%, and a 1 year total shareholder return that slipped 1.02%. This suggests that short term momentum is soft, while longer term performance has also been under pressure.
Scan how Kyowa Kirin’s update compares with other pharma pipelines by reviewing the hand picked list of solid balance sheet and fundamentals (20 results) that may be better positioned for the next clinical catalyst cycle.
Kyowa Kirin has a broad late stage pipeline and reports positive annual revenue and net income growth, yet the share price is still down over 10% in 90 days. Is that a quality business offered at a fair tag today?
Preferred P/E of 14.6x: Is it justified for Kyowa Kirin?
On Simply Wall St’s estimates, Kyowa Kirin trades on a P/E of 14.6x, which aligns with the 14.6x average for the JP Pharmaceuticals group and sits below the peer average of 15.9x, while the SWS fair P/E ratio is calculated at 22.5x.
The P/E multiple compares the share price to earnings per share and gives a quick read on how the market prices each unit of profit. For a research led pharmaceutical business like Kyowa Kirin, where earnings can be influenced by patent cycles and clinical outcomes, the P/E provides a simple way to weigh the current price against the profitability that is already visible in the accounts.
With earnings growth over the past year reported at 111.7% and a 5 year annual earnings growth rate of 5.7%, the current 14.6x P/E indicates the market is not attaching a premium to this profit record relative to peers on 15.9x. Compared to the fair P/E estimate of 22.5x, the trading multiple also sits materially lower. This signals a valuation level that could move closer to that fair ratio if sentiment toward Kyowa Kirin’s pipeline and earnings outlook improves.
Against the wider JP Pharmaceuticals industry, pricing at the same 14.6x level indicates the stock is not being marked up or down versus the sector as a whole. Yet relative to the 22.5x modelled fair P/E, the current tag looks restrained and leaves room for the multiple to expand if investors come to value Kyowa Kirin’s earnings in line with that benchmark.
Explore the SWS fair ratio for Kyowa Kirin.
Result: Price-to-earnings of 14.6x (UNDERVALUED)
Still, the weak 5 year total return, which declined 40.09%, and the 90 day share price fall of 10.72% show that sentiment toward Kyowa Kirin can turn quickly if key trials disappoint or pipeline timings slip.
Find out about the key risks to this Kyowa Kirin narrative.
Another View on Kyowa Kirin’s Value
The SWS DCF model paints a different picture for Kyowa Kirin. At a share price of ¥2,265.5 versus an estimated future cash flow value of ¥3,679.22, it points to the stock trading at a steep discount. Is that a genuine margin of safety or just optimistic modelling?
For a closer look at how this cash flow view is constructed and what it assumes about Kyowa Kirin, Look into how the SWS DCF model arrives at its fair value.
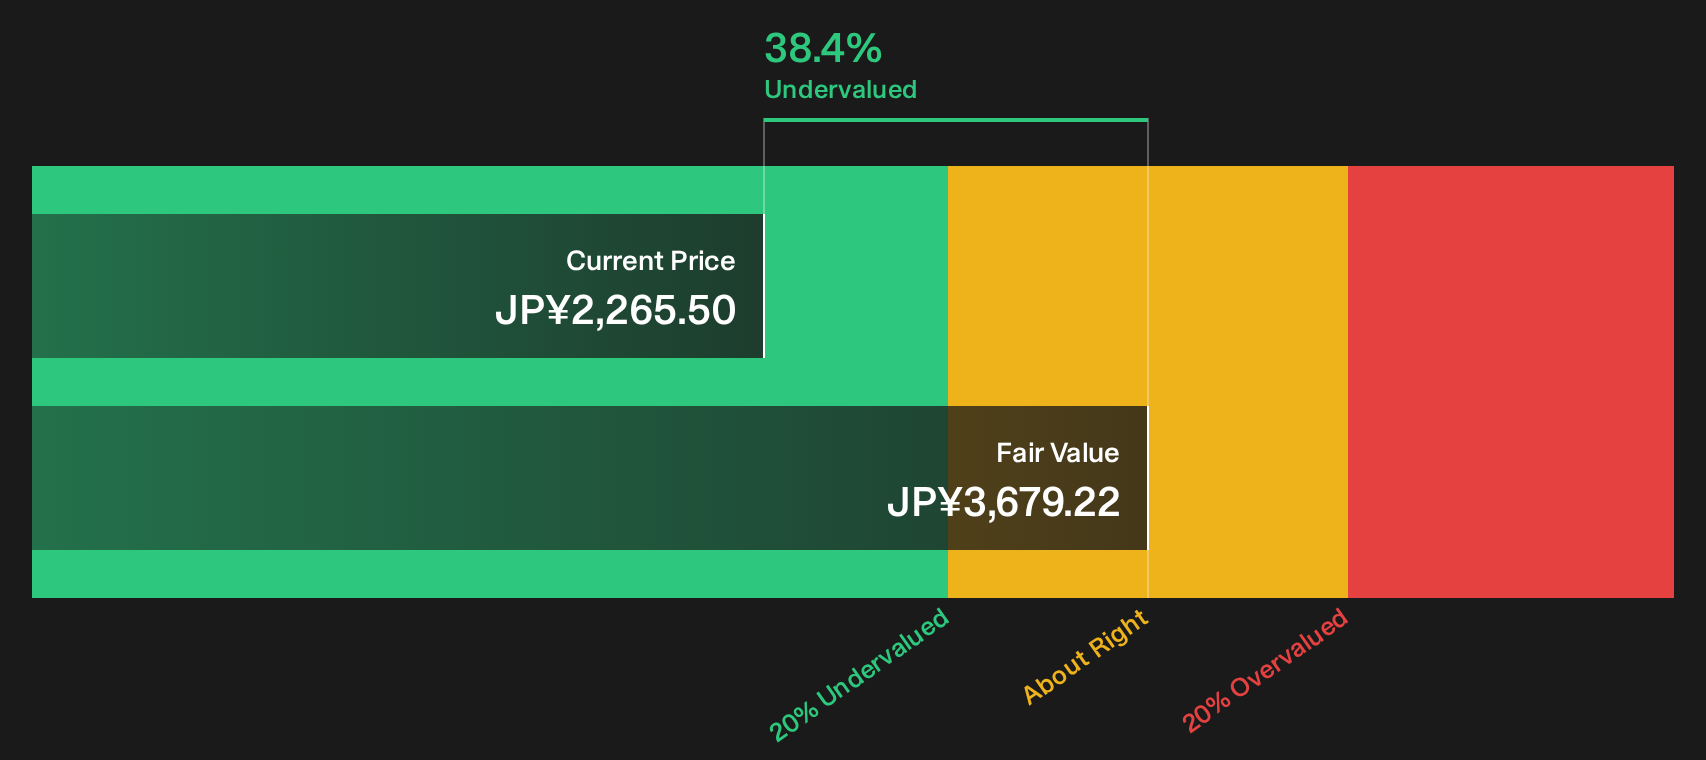
Simply Wall St performs a discounted cash flow (DCF) on every stock in the world every day (check out Kyowa Kirin for example). We show the entire calculation in full. You can track the result in your watchlist or portfolio and be alerted when this changes, or use our stock screener to discover 17 high quality undervalued stocks. If you save a screener we even alert you when new companies match - so you never miss a potential opportunity.
Next Steps
Curious whether the current mood around Kyowa Kirin matches your own read of the numbers and pipeline risk? Move quickly, examine the key drivers yourself, and weigh the upside signaled by the 4 key rewards.
Looking for more investment ideas beyond Kyowa Kirin?
If Kyowa Kirin has sharpened your focus, do not stop here. Broaden your watchlist so you always have fresh opportunities ready when sentiment shifts.
- Target resilient balance sheets and steady fundamentals by scanning the list of solid balance sheet and fundamentals (20 results) that could handle tougher conditions without forcing rushed decisions.
- Hunt for potential value gaps with the 17 high quality undervalued stocks and see which businesses the numbers suggest may be priced below their underlying strength.
- Build a watchlist of potential future leaders by reviewing the 74 high quality undiscovered gems before the wider market pays closer attention.
This article by Simply Wall St is general in nature. We provide commentary based on historical data and analyst forecasts only using an unbiased methodology and our articles are not intended to be financial advice. It does not constitute a recommendation to buy or sell any stock, and does not take account of your objectives, or your financial situation. We aim to bring you long-term focused analysis driven by fundamental data. Note that our analysis may not factor in the latest price-sensitive company announcements or qualitative material. Simply Wall St has no position in any stocks mentioned.
Have feedback on this article? Concerned about the content? Get in touch with us directly. Alternatively, email editorial-team@simplywallst.com