


Tobu Railway (TSE:9001) has drawn fresh attention after its recent close at ¥2,960, with returns mixed between a modest gain over the past 3 months and a decline in the latest session.
Recent trading paints a mixed picture for Tobu Railway, with the share price down 1.43% over the last session yet supported by an 11.57% year to date share price return and a 12.45% total shareholder return over the past year. The 3 year total shareholder return is still down 21.07%, suggesting improving momentum off a weaker longer term base.
Compare Tobu Railway's recent swing in returns with a curated shortlist of resilient stocks in our 21 resilient stocks with low risk scores.
Tobu Railway now sits between a bull case built on improving shareholder returns and a bear case focused on softer profit growth. Which side do the current valuation signals appear to support next?
Price-to-Earnings of 10.4x: Is it justified?
Tobu Railway trades on a P/E of 10.4x at a share price of ¥2,960, which appears relatively low compared with both peers and the wider Japanese market.
The P/E ratio compares what investors are paying today for each unit of earnings. For a transport operator with a mix of rail, real estate, and leisure assets, this metric gives a quick sense of how the market is weighing current profit against a broad, asset-heavy business model.
Recent earnings growth of 10.7% over the past year, following several years of profit expansion, suggests the current P/E reflects fairly modest expectations. The stock trades at a discount to the estimated fair P/E of 13.3x, which indicates a level the market may consider reasonable if sentiment or results support it.
At the same time, the 10.4x multiple still looks restrained compared with the JP Transportation industry average of 12.4x and the wider JP market at 14.1x. The gap across all three comparisons indicates investors are pricing Tobu Railway more conservatively than both sector peers and the broader market.
Explore the SWS fair ratio for Tobu Railway.
Result: Price-to-Earnings of 10.4x (UNDERVALUED)
Still, the recent annual net income decline of 3.8% and only 1.9% revenue growth leave room for disappointment if Tobu Railway faces any operational setback.
Find out about the key risks to this Tobu Railway narrative.
Another View on Tobu Railway’s Value
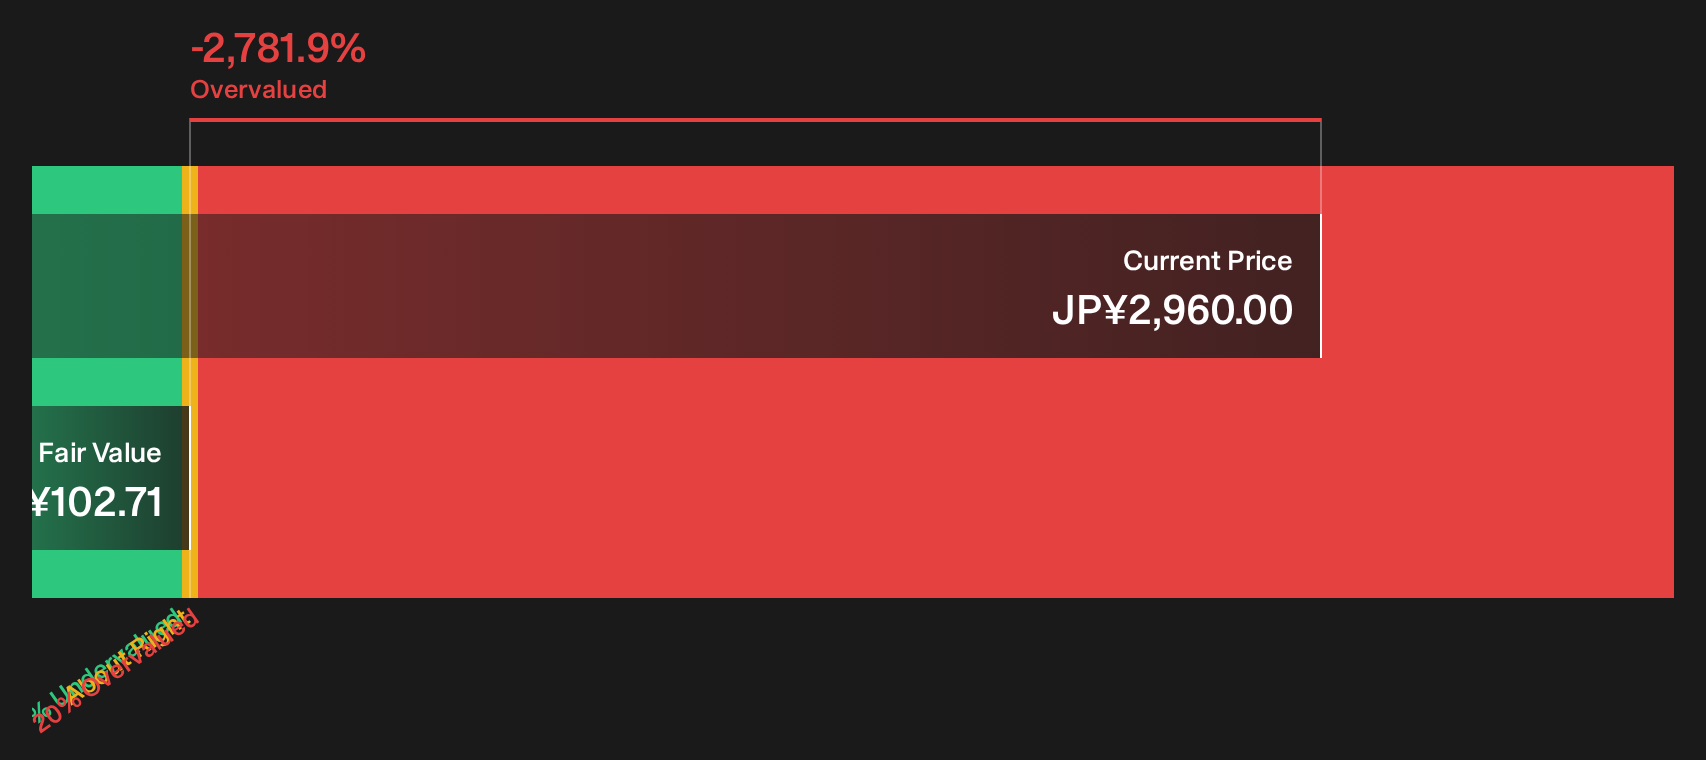
The P/E points to Tobu Railway looking inexpensive, yet the SWS DCF model tells a very different story. That cash flow based approach puts fair value at ¥102.71 per share, far below the current ¥2,960 level, which frames the stock as heavily overvalued on that metric.
Both methods lean on earnings power, but one watches today’s profits while the other leans on long range cash flows. When those views collide this sharply, which lens do you trust more for your own process: the market multiple or the cash flow path next?
Look into how the SWS DCF model arrives at its fair value.
Simply Wall St performs a discounted cash flow (DCF) on every stock in the world every day (check out Tobu Railway for example). We show the entire calculation in full. You can track the result in your watchlist or portfolio and be alerted when this changes, or use our stock screener to discover 17 high quality undervalued stocks. If you save a screener we even alert you when new companies match - so you never miss a potential opportunity.
Next Steps
Mixed signals on Tobu Railway so far. If you want to move quickly and make your own call, you can weigh both sides of the story with the 3 key rewards and 3 important warning signs.
Looking for more Tobu Railway style investment ideas?
If Tobu Railway has sharpened your focus on valuation and risk, use fresh stock ideas from the Simply Wall Street Screener so you do not leave potential opportunities on the table.
- Target quality at a discount by scanning our curated set of companies that look mispriced on fundamentals through the 17 high quality undervalued stocks.
- Prioritise resilience by focusing on businesses with stronger balance sheets and financial foundations using the list of solid balance sheet and fundamentals (20 results).
- Hunt for off-the-radar opportunities by filtering for financially robust smaller players in the 74 high quality undiscovered gems.
This article by Simply Wall St is general in nature. We provide commentary based on historical data and analyst forecasts only using an unbiased methodology and our articles are not intended to be financial advice. It does not constitute a recommendation to buy or sell any stock, and does not take account of your objectives, or your financial situation. We aim to bring you long-term focused analysis driven by fundamental data. Note that our analysis may not factor in the latest price-sensitive company announcements or qualitative material. Simply Wall St has no position in any stocks mentioned.
Have feedback on this article? Concerned about the content? Get in touch with us directly. Alternatively, email editorial-team@simplywallst.com