


Freedom Holding (FRHC) has drawn fresh attention after a recent move in its share price, with the stock closing at $174.13 and recording a 5.9% one day return.
The latest move slots into a stronger trend for Freedom Holding. The 90 day share price return of 25.09% and year to date share price return of 40.17% point to building momentum, while the 3 year total shareholder return of 100.54% highlights how longer term holders have been rewarded, despite a more modest 1 year total shareholder return of 3.99%.
Scan momentum across similar stories by comparing Freedom Holding with a hand picked group of 17 high quality undiscovered gems that have also been catching fresh attention in recent months.
For Freedom Holding, a 5.9% jump and strong multi year returns can signal either improving conviction in the business or a mood shift in the market. How does that recent enthusiasm line up with the current valuation?
Price-to-Earnings of 75.2x: Is it justified?
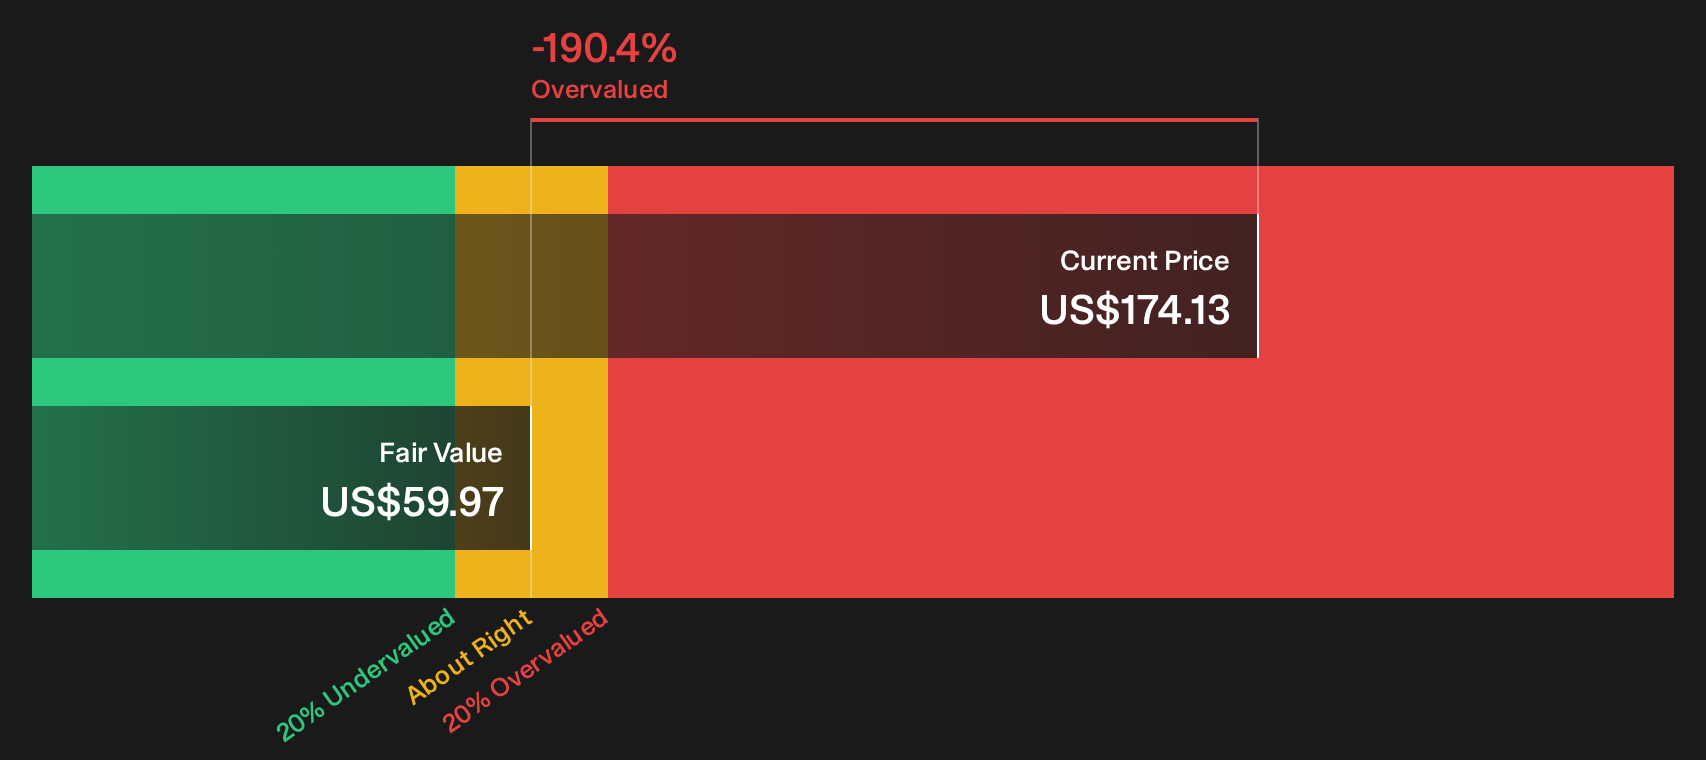
On valuation, the key tension for Freedom Holding is that the stock closed at $174.13 while the SWS DCF model indicates a future cash flow value of $59.97, and the market is also paying a rich P/E multiple of 75.2x.
The P/E ratio compares what investors are willing to pay today for each dollar of current earnings. For a diversified financial group like Freedom Holding, a higher P/E can reflect expectations for sustained profitability, stronger earnings quality or a perception that recent profit momentum can be maintained.
Recent fundamentals add nuance. Earnings growth over the past year was 86.3% and current net profit margins of 8.4% are higher than last year’s 5.1%, and earnings growth over the past year also exceeded the Capital Markets industry’s 32.9%. At the same time, earnings have declined by 17% per year over the past 5 years and Return on Equity of 9.6% is described as low, which raises questions about how durable the recent improvement is relative to what the market is paying.
Compared with peers, the premium is clear. Freedom Holding trades on a P/E of 75.2x versus the US Capital Markets industry average of 39.6x and a peer average of 11.9x, and the shares are also trading above the SWS DCF estimate of future cash flow value at $59.97. Both the high multiple and the gap to the DCF number suggest investors are pricing in a much stronger earnings profile than historic 5 year trends alone would imply.
See what the numbers say about this price — find out in our valuation breakdown.
Result: Price-to-Earnings of 75.2x (OVERVALUED)
Still, any stumble in Freedom Holding's earnings trajectory, or a shift in sentiment toward high P/E financial groups, could quickly challenge the current enthusiasm.
Find out about the key risks to this Freedom Holding narrative.
Another View on Freedom Holding's Value
The earlier discussion highlighted how Freedom Holding trades on a rich P/E, yet the SWS DCF model points to a very different story. At $174.13, the stock sits well above the DCF estimate of future cash flow value at $59.97, which frames the shares as overvalued on this method.
That gap suggests investors are either assigning a premium far beyond what current cash flow assumptions support, or the DCF inputs are too conservative for how the market now sees Freedom Holding. Which side of that argument you lean toward depends on how much faith you put in future earnings power versus present fundamentals.
Look into how the SWS DCF model arrives at its fair value.
Simply Wall St performs a discounted cash flow (DCF) on every stock in the world every day (check out Freedom Holding for example). We show the entire calculation in full. You can track the result in your watchlist or portfolio and be alerted when this changes, or use our stock screener to discover 30 high quality undervalued stocks. If you save a screener we even alert you when new companies match - so you never miss a potential opportunity.
Next Steps
Plenty in this Freedom Holding story points in different directions, so if it feels mixed that is the point. Act quickly, review the figures for yourself, and weigh both the upside potential and the concerns highlighted by our summary of 1 key reward and 2 important warning signs
Looking for more investment ideas beyond Freedom Holding?
Freedom Holding might be front of mind today, but your capital deserves a wider field of contenders before you commit your next dollar.
- Target undervalued quality by scanning companies that combine solid fundamentals with appealing prices using the 30 high quality undervalued stocks.
- Prioritise resilience by focusing on businesses with strong finances through the list of solid balance sheet and fundamentals (23 results).
- Build a smoother ride for your portfolio by concentrating on steadier performers via the 30 resilient stocks with low risk scores.
This article by Simply Wall St is general in nature. We provide commentary based on historical data and analyst forecasts only using an unbiased methodology and our articles are not intended to be financial advice. It does not constitute a recommendation to buy or sell any stock, and does not take account of your objectives, or your financial situation. We aim to bring you long-term focused analysis driven by fundamental data. Note that our analysis may not factor in the latest price-sensitive company announcements or qualitative material. Simply Wall St has no position in any stocks mentioned.
Have feedback on this article? Concerned about the content? Get in touch with us directly. Alternatively, email editorial-team@simplywallst.com