


Skyward Specialty Insurance Group has delivered a powerful 3 year share price run, which naturally puts the focus on whether the current valuation can still be explained by its earnings. With the stock now around US$55.91, the question for you is how much of the insurance group's earnings power is already baked into that figure.
- Over the last 3 years the share price has gained about 99.7%, so the long term holders now need to ask if earnings can justify that kind of step up.
- The business model relies on underwriting discipline and risk selection, which can support earnings if pricing, claims trends and capital use stay aligned with management's approach.
- The analysts covering Skyward Specialty Insurance Group have run their own numbers. See what analysts think Skyward Specialty Insurance Group's shares could be worth.
The issue now is whether Skyward Specialty Insurance Group's current share price is in line with what its earnings suggest it should be worth.
If you are weighing whether Skyward Specialty Insurance Group's 3 year gain and current earnings justify the price, it can help to compare with a focused screen of 29 high quality undervalued stocks.
Is Skyward Specialty Insurance Group Fairly Priced on Earnings?
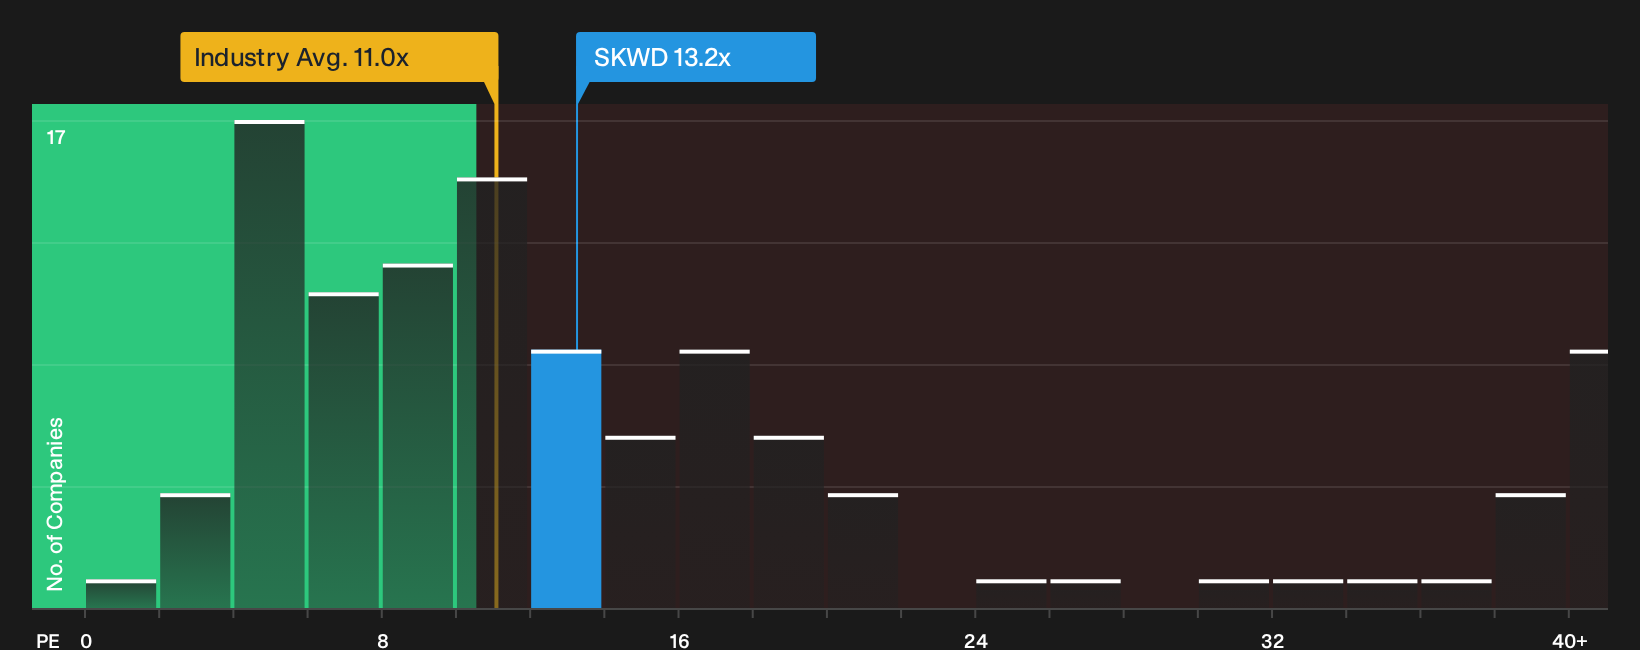
The P/E ratio tends to suit Skyward Specialty Insurance Group because earnings are a central reference point for how investors usually judge insurers. On this lens, the stock trades on a P/E of about 13.2x, compared with an Insurance sector average of roughly 10.7x and a peer group closer to 8.1x. That means the valuation currently carries a visible premium to both the wider industry and more focused peers.
The fair-value model that adjusts for Skyward Specialty Insurance Group's own return on equity, book value and risk profile points to a P/E level that is close to where the shares trade now. As a result, the market price is not far from what this tailored framework suggests would be a balanced multiple, even if it is richer than the simpler industry and peer benchmarks. If you own or are researching the stock, the key question is whether the earnings profile you expect justifies paying near this modelled level rather than hunting for a clear discount elsewhere. Explore the numbers behind Skyward Specialty Insurance Group's P/E valuation.
The Skyward Specialty Insurance Group Narrative: What Would Justify Today's Price?
Narratives for Skyward Specialty Insurance Group pick up exactly where the valuation puzzle leaves you by spelling out which paths for future growth, profitability and earnings would need to play out for the stock to be worth materially more or less than today’s price. Each narrative sets out the assumptions behind its own fair value view in a structured way, so you can later compare those inputs with Skyward Specialty Insurance Group's reported results as new numbers arrive.
One of the top community narratives on Skyward Specialty Insurance Group: 21% undervalued
"Selective underwriting, data-driven cycle management, and strategic partnerships enable high-quality, sustainable earnings insulated from commoditized market pressures..."
Discover why this Narrative puts Skyward Specialty Insurance Group at 21% undervalued.
One more angle on Skyward Specialty Insurance Group that could shift your view
Valuation only tells you where Skyward Specialty Insurance Group trades today, while professional coverage sketches out where the business might be a few years from now and how that stacks up against the current multiple. Explore where analysts expect Skyward Specialty Insurance Group to be in a few years.
This article by Simply Wall St is general in nature. We provide commentary based on historical data and analyst forecasts only using an unbiased methodology and our articles are not intended to be financial advice. It does not constitute a recommendation to buy or sell any stock, and does not take account of your objectives, or your financial situation. We aim to bring you long-term focused analysis driven by fundamental data. Note that our analysis may not factor in the latest price-sensitive company announcements or qualitative material. Simply Wall St has no position in any stocks mentioned.
Have feedback on this article? Concerned about the content? Get in touch with us directly. Alternatively, email editorial-team@simplywallst.com