


ASML Holding (NasdaqGS:ASML) continues to attract attention after its recent share move. The stock closed at US$1,747.90 and delivered a year-to-date return of 50.2%.
ASML Holding’s recent 2.1% 1-day share price return and 9.8% 7-day share price gain come after a period where momentum faded over the past quarter. However, the 50.2% year to date share price return and 82.4% 1-year total shareholder return still point to strong underlying interest and shifting risk expectations.
Scan beyond ASML Holding’s surge and size up other chip-related plays with the 86 AI infrastructure stocks that are helping power the same semiconductor and AI infrastructure story.
After a 50.2% year to date jump and an 82.4% 1 year total return, ASML Holding now asks a simple question of new buyers: Does the current valuation still leave enough upside to justify the risk?
Price-to-Earnings of 54.4x for ASML Holding: Is it justified?
ASML Holding changes hands at a P/E of 54.4x, which places a rich valuation on the current $1,747.90 share price compared with peers and internal fair value estimates.
The P/E ratio compares what investors are paying today for each dollar of current earnings. For a specialist semiconductor equipment supplier like ASML Holding, this metric often reflects expectations around future profit growth, capital intensity, and the durability of its position in the chipmaking supply chain.
Analysts currently expect ASML's earnings to expand by 21.5% per year, with revenue forecast to rise 16.2% annually and Return on Equity already at an outstanding 48.7% and forecast to reach 59.8%. A rich P/E can indicate that the market is willing to pay up for those forecasts, although the current 54.4x multiple is expensive relative to the estimated fair P/E of 40.5x. This is a level the valuation could move toward if sentiment cools or results do not match expectations.
The comparison with peers is just as stark. ASML Holding trades at a higher P/E than both the peer average of 49.8x and the broader US Semiconductor industry average of 49.3x, showing investors are assigning a clear premium to this stock based on expected profit growth and quality metrics.
Explore the SWS fair ratio for ASML Holding.
Result: Preferred multiple of 54.4x price-to-earnings (OVERVALUED)
Still, the ASML Holding story can be knocked off course if chip cycle demand softens or if export restrictions tighten further in key Asian markets.
Find out about the key risks to this ASML Holding narrative.
Another View on ASML Holding’s Value
The P/E ratio portrays ASML Holding as expensive, and the SWS DCF model goes further. On that cash flow view, the current $1,747.90 share price sits well above an estimated value of $947.20. This indicates a rich setup and raises a simple question: What if expectations are already fully priced in?
Look into how the SWS DCF model arrives at its fair value.
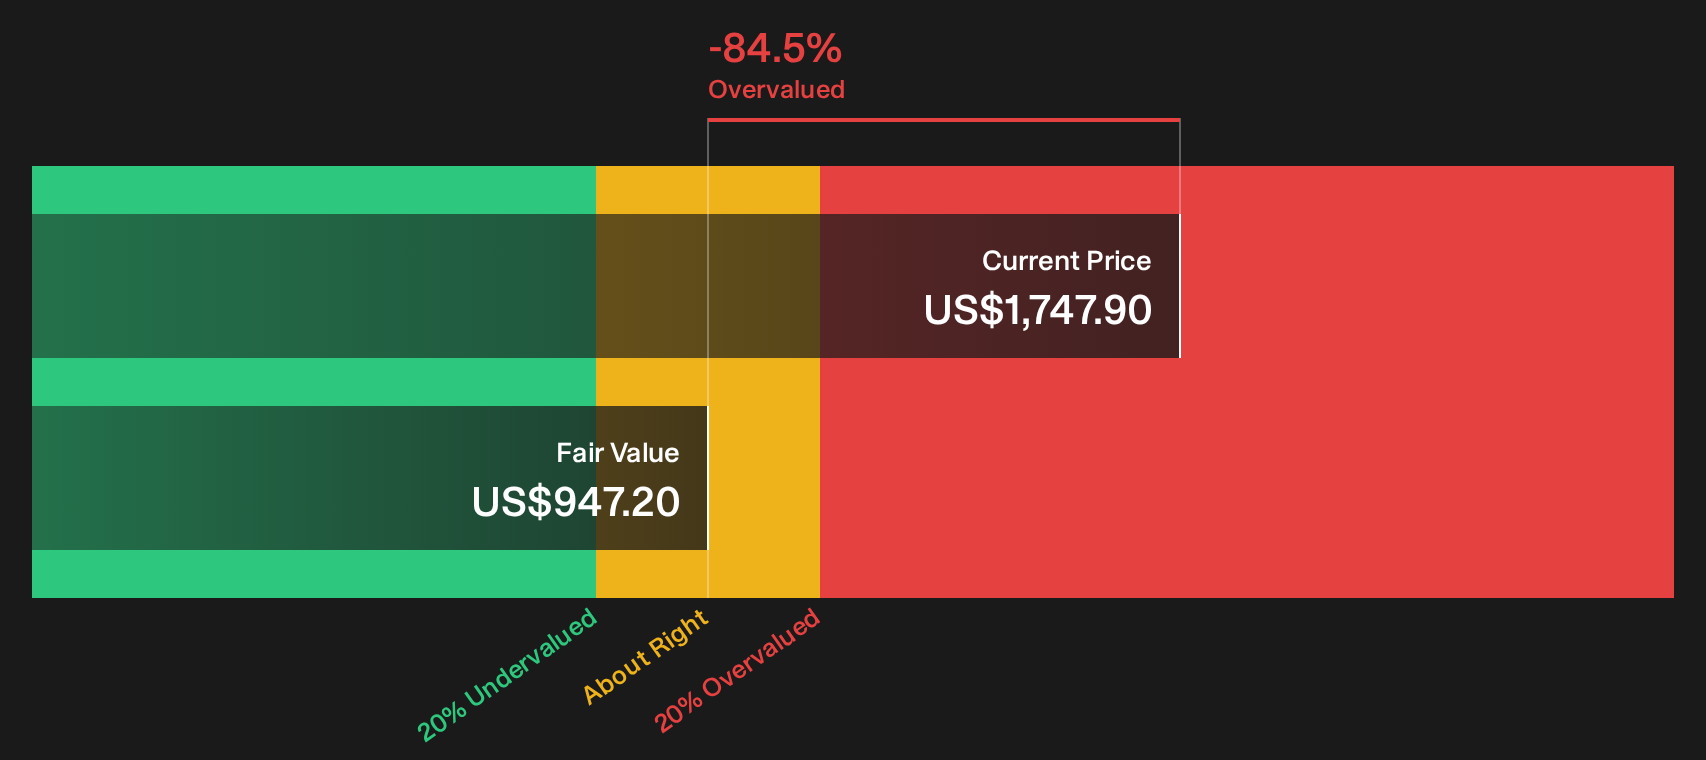
Simply Wall St performs a discounted cash flow (DCF) on every stock in the world every day (check out ASML Holding for example). We show the entire calculation in full. You can track the result in your watchlist or portfolio and be alerted when this changes, or use our stock screener to discover 29 high quality undervalued stocks. If you save a screener we even alert you when new companies match - so you never miss a potential opportunity.
Next Steps
Sentiment around ASML Holding is clearly mixed, with strong returns set against a punchy valuation. Do not wait to interrogate the numbers yourself and stress test the narrative using the 2 key rewards.
Looking for more ASML Holding sized ideas?
If ASML Holding feels fully priced, do not park your cash on the sidelines. Use curated screeners to spot fresh opportunities with clear, data driven edges.
- Target dependable cash generators and broaden your watchlist with the 29 high quality undervalued stocks.
- Prioritise resilience in choppy markets by scanning the 30 resilient stocks with low risk scores.
- Hunt for future leaders flying under the radar through the 16 high quality undiscovered gems.
This article by Simply Wall St is general in nature. We provide commentary based on historical data and analyst forecasts only using an unbiased methodology and our articles are not intended to be financial advice. It does not constitute a recommendation to buy or sell any stock, and does not take account of your objectives, or your financial situation. We aim to bring you long-term focused analysis driven by fundamental data. Note that our analysis may not factor in the latest price-sensitive company announcements or qualitative material. Simply Wall St has no position in any stocks mentioned.
Have feedback on this article? Concerned about the content? Get in touch with us directly. Alternatively, email editorial-team@simplywallst.com