


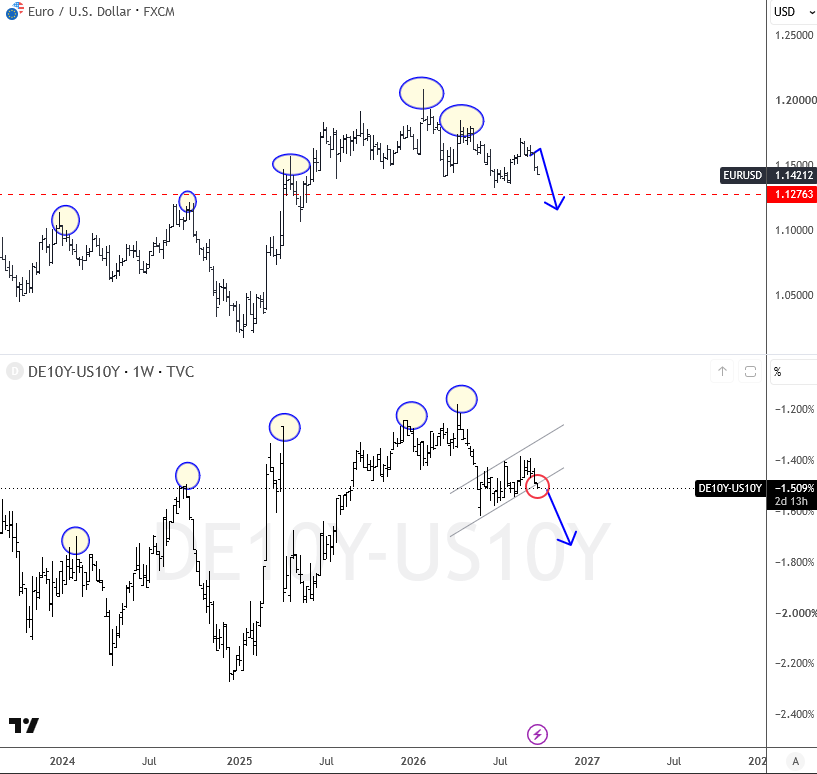
As you know, EURUSD has turned quite nicely to the downside over the last few weeks, especially after the Fed delivered a very hawkish message with its latest rate decision. This is making the US dollar more attractive relative to the euro. In fact, if we look at the German-US yield spread, we can see a potential breakdown from a bearish flag, suggesting that US yields could continue to rise faster than German yields. This could keep EURUSD under pressure.
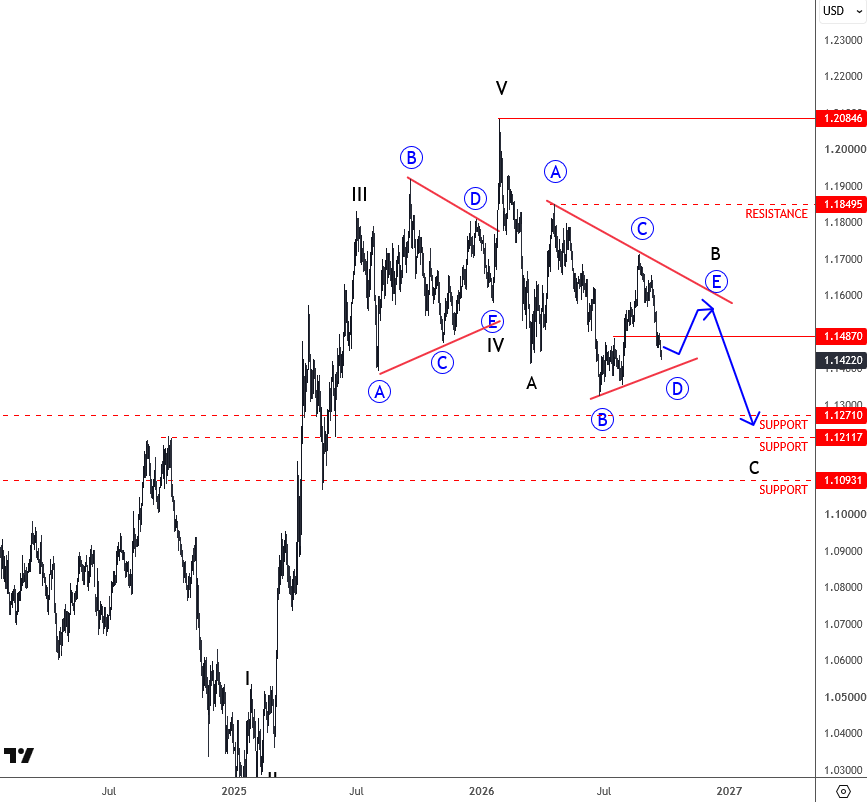
Looking at the updated wave structure, notice that we saw an important overlap below 1.1480 last week. This suggests that the recovery from the June lows was corrective and could be part of a more complex higher-degree correction. We are currently observing a running triangle scenario in wave B, where another leg higher could still develop from around the 1.1400 support area. This is also near the lower trend line of the contracting range, connected from the June 23 and July 27 swing lows.
An Elliott Wave triangle is a contracting sideways correction with overlapping subwaves; in a running triangle, one extreme can exceed the start of the pattern. This describes the pattern without changing the current wave count.
So if we see a rally from this area, it would not surprise us, but we would still consider it a potentially temporary rebound before another leg lower in wave C.
Eventually, EURUSD could even move closer to the 1.1200 area, which was an important swing high area back in June 2023 and October 2024.
We talked about this in our webinar on Monday — see it here: watch the replay
If you would like to explore this analysis further, apply for a free 7-day trial is available.
Trade well, Grega