


OMRON Corporation has delivered a sharp share price rebound over the past year, which puts fresh focus on whether its current earnings really support where the stock now trades. After such a reset, the key issue for investors is whether the recent move reflects a durable earnings base or expectations that have run ahead of the business.
- OMRON shares are up 54.7% over the past year, which puts more pressure on the question of how much of that shift is grounded in its earnings power.
- The group’s valuation now leans heavily on how efficiently it can turn its automation and healthcare operations into steady profit, because cash generation and margins will shape what investors are effectively paying for each unit of earnings.
- The analysts covering OMRON have run their own numbers. See what analysts think OMRON's shares could be worth.
The issue now is whether OMRON’s current share price is justified by the earnings its business produces today and the profit stream investors expect it to deliver from here.
If you want a clearer benchmark for OMRON's earnings-driven story, it helps to compare it with other 95 robotics and automation stocks.
Does OMRON Look Pricey on Earnings?
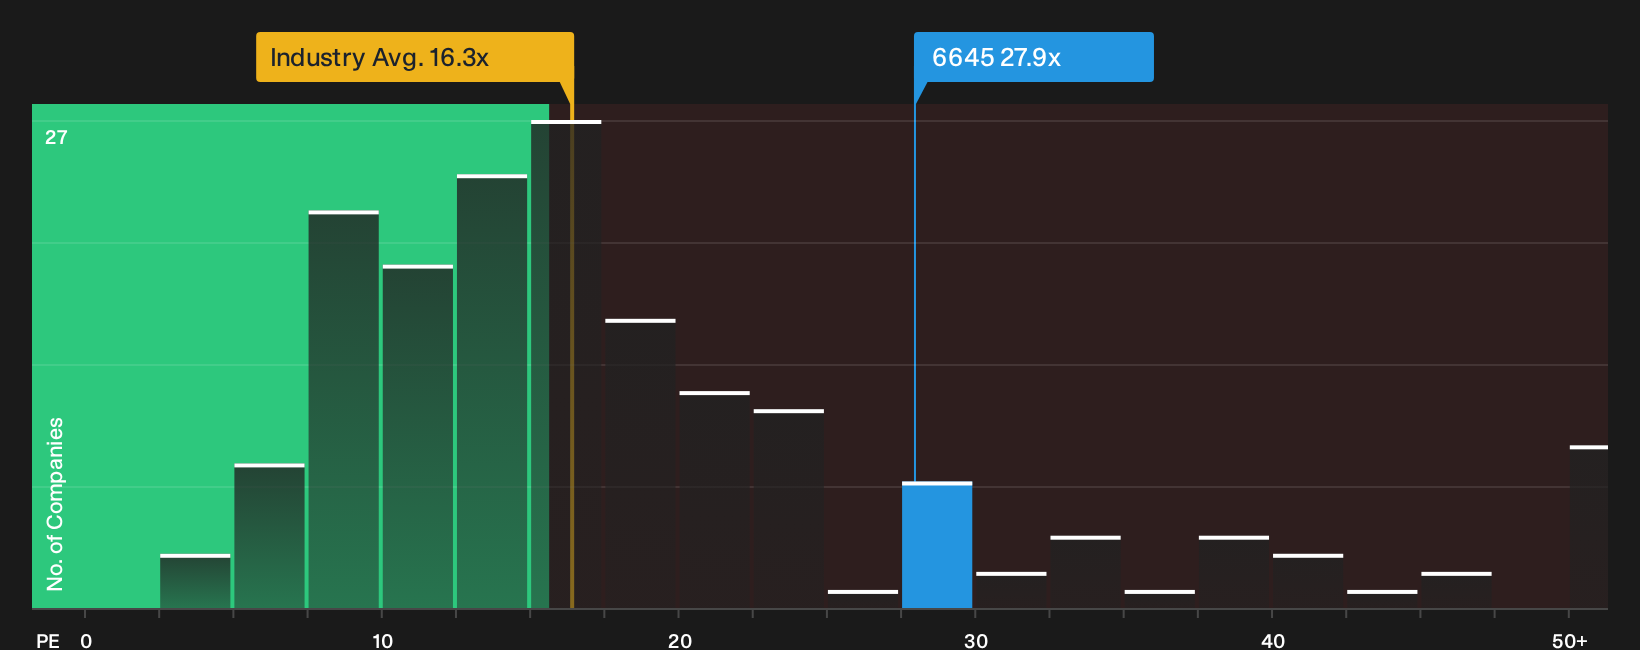
The P/E ratio works reasonably well for OMRON because the market is clearly keying off earnings for this kind of automation and healthcare business. Right now the stock trades on about 27.9x earnings, which is above the broader Electronic industry average of roughly 16.3x but below the peer group on around 41.4x. That indicates investors are paying a premium to the sector for OMRON’s profit stream, while still not awarding it the richest multiples seen in more highly rated rivals.
A tailored fair P/E that adjusts for OMRON’s own growth profile, margins, size and risk points to a lower level than where the shares currently change hands, which implies the stock screens overvalued on this framework. For anyone weighing an entry, that gap means you would be accepting a richer multiple than the model suggests for the earnings on offer, and you would need strong conviction about the quality and durability of those profits to be comfortable with that trade off. Explore the numbers behind OMRON's P/E valuation.
The OMRON Narrative: What Would Justify Today's Price?
Simply Wall St Narratives for OMRON pick up where the valuation puzzle leaves off by explaining what kind of future growth, profitability and earnings path would need to occur for the stock to be worth meaningfully more or less than it is today. Each scenario is tied to a clear view on where OMRON's growth, margins and key risks might go next, which you can revisit as new information appears on the Community page.
A clear, number-driven narrative on OMRON right now helps you pin down what earnings, margins and cash generation would need to look like for today’s valuation to make sense. It also gives you a concrete set of assumptions you can revisit over time as the business updates its results and refines its execution.
Share your own Narrative for OMRON and set out the assumptions behind your valuation.
One more piece in the OMRON valuation puzzle
There is one question still hanging over OMRON. How the professional research community sees its earnings profile a few years from now gives you another lens to compare with where the shares trade today. Explore where analysts expect OMRON to be in a few years.
This article by Simply Wall St is general in nature. We provide commentary based on historical data and analyst forecasts only using an unbiased methodology and our articles are not intended to be financial advice. It does not constitute a recommendation to buy or sell any stock, and does not take account of your objectives, or your financial situation. We aim to bring you long-term focused analysis driven by fundamental data. Note that our analysis may not factor in the latest price-sensitive company announcements or qualitative material. Simply Wall St has no position in any stocks mentioned.
Have feedback on this article? Concerned about the content? Get in touch with us directly. Alternatively, email editorial-team@simplywallst.com