


Sartorius stock: why a Dublin training hub is catching investor attention
Sartorius (XTRA:SRT3) has moved back onto watchlists after agreeing to help build a large bioprocessing training center in Dublin and stepping up its presence at several high profile healthcare conferences this month.
The Dublin partnership with Ireland’s National Institute for Bioprocessing Research and Training gives the group a platform to showcase its Pionic continuous bioprocessing technology in a live teaching environment. A series of September conference slots in New York, Frankfurt, Munich and London puts management in front of global investors at the same time.
Recent catalysts seem to be feeding into that story. The share price has a 15.31% 90 day share price return and a 20.89% 1 year total shareholder return, even though the 3 year and 5 year total shareholder returns remain sharply negative. This suggests sentiment has improved, but long term holders are still under water.
Extend your watchlist beyond Sartorius by scanning a hand picked set of resilient biopharma suppliers with strong fundamentals using the 620 high quality undiscovered gems.
For Sartorius, the recent rebound can look like a simple mood swing or a reassessment of a €15.8b business with growing revenue and earnings. Which story do the current valuation markers support?
Price-to-earnings of 89.1x: is it justified for Sartorius?
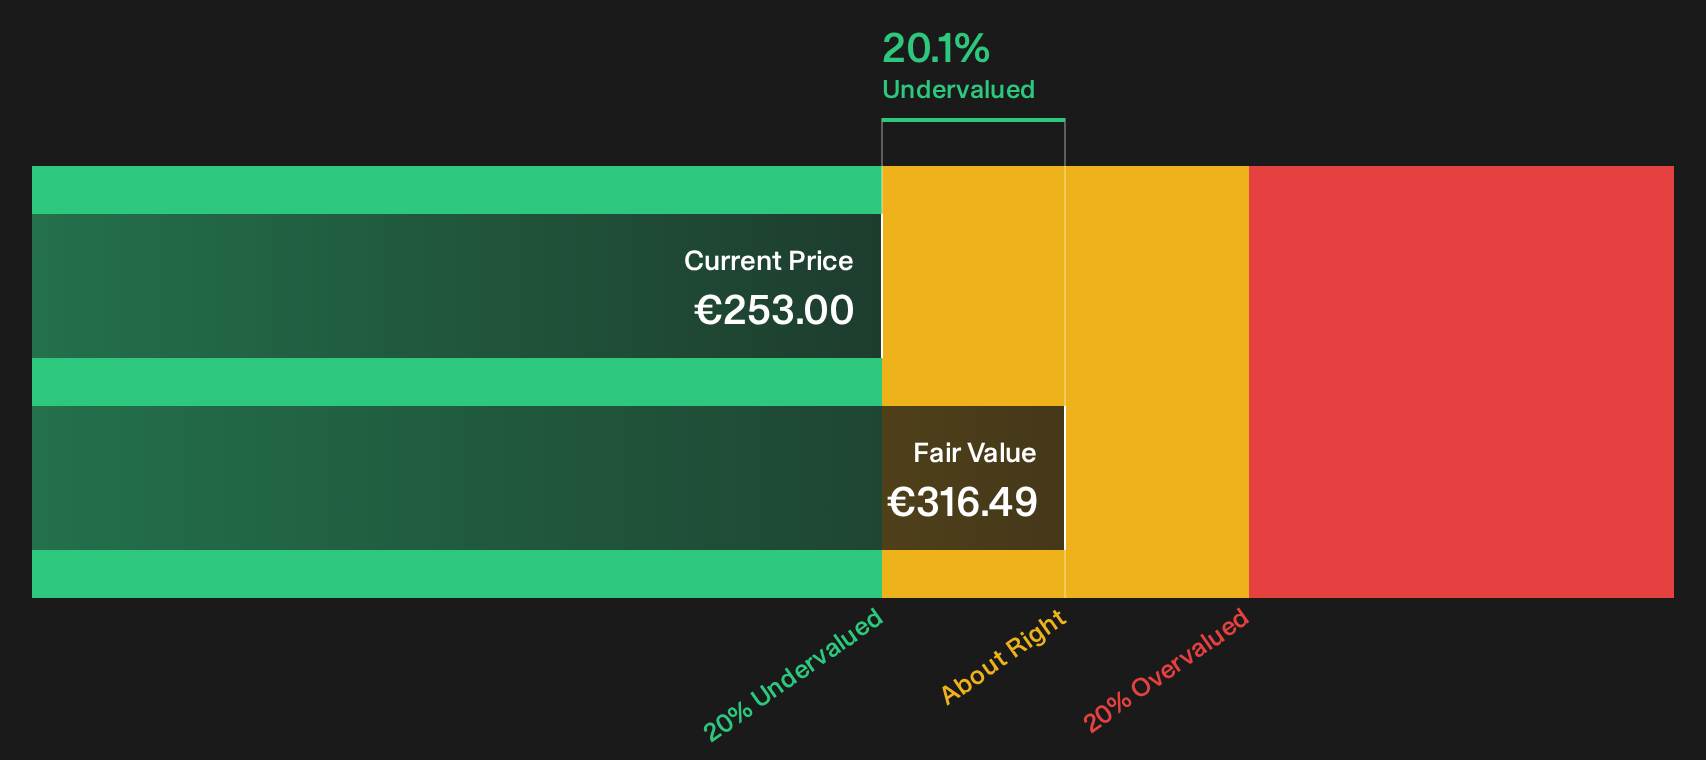
The SWS DCF model points to a fair value of €316.49 for Sartorius, which is above the last close of €253 and suggests the share price is below that cash flow based estimate. However, the preferred valuation lens in the market right now is a rich P/E of 89.1x that sits well above typical levels for this sector.
The P/E ratio compares what investors pay today for each euro of current earnings. For life sciences suppliers like Sartorius, a higher multiple often signals that the market is willing to pay up for expected profit expansion, recurring revenue streams, or perceived resilience in demand from biopharma customers.
In this case, the 89.1x P/E lines up against earnings growth that has recently been strong, with profit rising 88.4% over the past year and annual profit growth of 20.34% forecast, while a 5.5% net margin, high quality earnings and an expected 20.3% annual increase in earnings add some context for why buyers might accept a richer tag on current profits.
The comparison to peers is stark, though. Sartorius trades at 89.1x earnings while the global life sciences industry sits at 38x, and the peer average is 46.7x, and the estimated fair P/E of 37.6x is also far lower. This indicates the current market multiple is materially above levels the DCF based fair ratio points toward as a potential anchor.
Explore the SWS fair ratio for Sartorius.
Result: Price-to-earnings of 89.1x (OVERVALUED)
Still, if earnings growth, margin resilience or sentiment toward life sciences suppliers soften, Sartorius could see that 89.1x P/E multiple come under pressure.
Find out about the key risks to this Sartorius narrative.
Another view on Sartorius valuation
On earnings, Sartorius trades on a steep 89.1x P/E. The SWS DCF model sketches a different picture. At a fair value of €316.49 versus a €253 share price, it points to the stock trading about 20.1% below that cash flow based estimate. Which lens do you treat as the anchor?
Look into how the SWS DCF model arrives at its fair value.
Simply Wall St performs a discounted cash flow (DCF) on every stock in the world every day (check out Sartorius for example). We show the entire calculation in full. You can track the result in your watchlist or portfolio and be alerted when this changes, or use our stock screener to discover 173 high quality undervalued stocks. If you save a screener we even alert you when new companies match - so you never miss a potential opportunity.
Next Steps
Sentiment on Sartorius clearly splits opinions. Move fast, review the underlying numbers, and let the mix of risks and upside potential inform your own stance with the 3 key rewards and 1 important warning sign.
Looking for more Sartorius investment ideas?
If Sartorius is back on your radar, it can pay to widen the lens and compare it with other high quality opportunities before making any portfolio moves.
- Target resilience by scanning a 229 resilient stocks with low risk scores that flags businesses with steadier profiles when volatility picks up.
- Hunt for stronger value by reviewing a 173 high quality undervalued stocks that filters for quality companies priced below their fundamentals.
- Build a sturdier core by using a list of solid balance sheet and fundamentals (198 results) that spotlights businesses with healthier financial footing.
This article by Simply Wall St is general in nature. We provide commentary based on historical data and analyst forecasts only using an unbiased methodology and our articles are not intended to be financial advice. It does not constitute a recommendation to buy or sell any stock, and does not take account of your objectives, or your financial situation. We aim to bring you long-term focused analysis driven by fundamental data. Note that our analysis may not factor in the latest price-sensitive company announcements or qualitative material. Simply Wall St has no position in any stocks mentioned.
Have feedback on this article? Concerned about the content? Get in touch with us directly. Alternatively, email editorial-team@simplywallst.com