


FLEX LNG has delivered a powerful long term run, yet the question now is whether the current share price still lines up with what its earnings can reasonably support. After a stretch of strong gains and some recent pullback, investors are asking if the market is paying too much attention to the share chart and not enough to the profit engine behind the business.
- Over the past 5 years, FLEX LNG has returned 213.9%, which puts real pressure on the question of whether its current price is still anchored to its earnings power.
- The company’s model of chartering out liquefied natural gas carriers may support relatively visible revenue and profit streams, which can be crucial when you are judging how much of today’s valuation is backed by ongoing earnings rather than hope.
- The analysts covering FLEX LNG have run their own numbers. See what analysts think FLEX LNG's shares could be worth.
The issue now is whether FLEX LNG’s current share price is justified by its earnings when lined up against the Fair Ratio benchmark.
If you are weighing whether FLEX LNG’s earnings really back up today’s share price, it can help to compare that same question across 29 high quality undervalued stocks.
Is FLEX LNG Getting Expensive on Earnings?
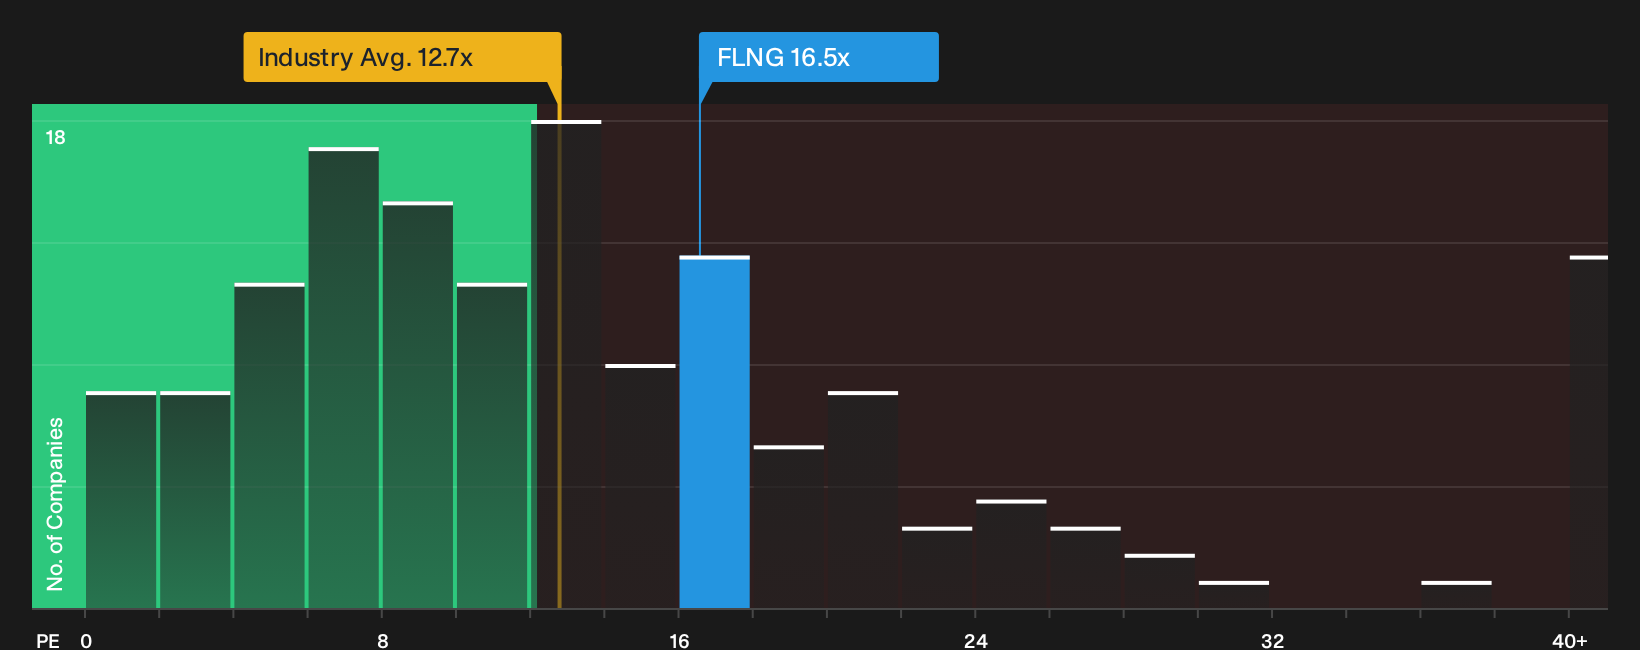
The P/E ratio fits FLEX LNG because earnings are a key way investors judge the stability of its charter income. On this measure, the stock trades on a P/E of 16.5x, which is above the broader Oil and Gas industry average of about 12.7x and also above the peer group around 14.0x. That means each dollar of current earnings from FLEX LNG is selling at a richer tag than many similar businesses in the sector.
The Fair Ratio framework, which adjusts the P/E investors might expect given FLEX LNG’s margins, business risks and size, points to a lower level than where the shares change hands today. The current 16.5x multiple therefore prices the stock at a premium to what that tailored yardstick suggests could be reasonable, and also above straightforward peer and sector benchmarks. This leaves you needing to decide whether the charter profile, balance sheet and future cash generation justify paying that higher earnings multiple or whether expectations have already moved ahead of the fundamentals. Explore the numbers behind FLEX LNG's P/E valuation.
The FLEX LNG Narrative: What Would Justify Today's Price?
Simply Wall St Narratives for FLEX LNG pick up where this valuation puzzle leaves off and explain what kind of future path for growth, margins and earnings would need to occur for the stock to be worth meaningfully more or less than where it trades today on the P/E of 16.5x. Each narrative connects its number to a clear view of how FLEX LNG's growth profile, profitability and key risks might evolve, giving you a reference point you can return to as fresh information comes through on the Community page.
One of the top community narratives on FLEX LNG: 21% overvalued
"The company's multi-year contract backlog and long-term charters secure steady revenue and earnings despite short-term market softness..."
Discover why this Narrative puts FLEX LNG at 21% overvalued.
FLEX LNG’s price is only one side of the investment story
Chart moves and earnings multiples tell only part of what you need to know about FLEX LNG, because recent research checks have surfaced potential concerns that some investors may want to weigh carefully before committing fresh capital. Take a closer look at 2 warning signs (2 major) before settling on a valuation.
This article by Simply Wall St is general in nature. We provide commentary based on historical data and analyst forecasts only using an unbiased methodology and our articles are not intended to be financial advice. It does not constitute a recommendation to buy or sell any stock, and does not take account of your objectives, or your financial situation. We aim to bring you long-term focused analysis driven by fundamental data. Note that our analysis may not factor in the latest price-sensitive company announcements or qualitative material. Simply Wall St has no position in any stocks mentioned.
Have feedback on this article? Concerned about the content? Get in touch with us directly. Alternatively, email editorial-team@simplywallst.com