


HealthEquity (HQY) has drawn fresh attention after its recent share performance, with the stock down over the past month but still positive over the past 3 months. That mix invites a closer look.
Over the past year, HealthEquity’s share price return has slipped slightly, reflected in a year to date decline of 0.75% and a 1 year total shareholder return decline of 4.11%. In contrast, longer horizons, such as the 3 year and 5 year total shareholder returns of 19.58% and 34.93%, point to momentum that has softened recently rather than collapsed.
Scan beyond HealthEquity and compare its recent pullback with a hand picked 30 high quality undervalued stocks that pair positive total returns with balance sheets and cash flows that already stack up on hard numbers.
HealthEquity now trades at a sizeable discount to both analyst targets and one estimate of intrinsic value after this pullback. Is that gap a sign of mispricing, or is the market simply pricing in justified caution?
Most Popular Narrative: 24% Undervalued
Set against HealthEquity’s last close of $90.39, the most followed narrative anchors fair value at about $119.33 using a 7.24% discount rate. That gap rests on a view that regulatory tailwinds and a larger HSA market can support stronger cash generation over time.
The recent regulatory expansion allowing direct primary care, pre-deductible telehealth, and millions of new ACA bronze/catastrophic plan members to qualify for HSAs creates the largest addressable market increase in two decades, poised to accelerate new account openings and AUM growth, meaningfully boosting future revenue.
See why 5 investors see HealthEquity as 24% undervalued.
Result: Fair Value of $119.33 (UNDERVALUED)
Still, the HealthEquity narrative can crack if a weaker labor market slows new HSA openings or if lower interest rates cut custodial yield and earnings power.
Find out about the key risks to this HealthEquity narrative.
Another View On HealthEquity’s Valuation
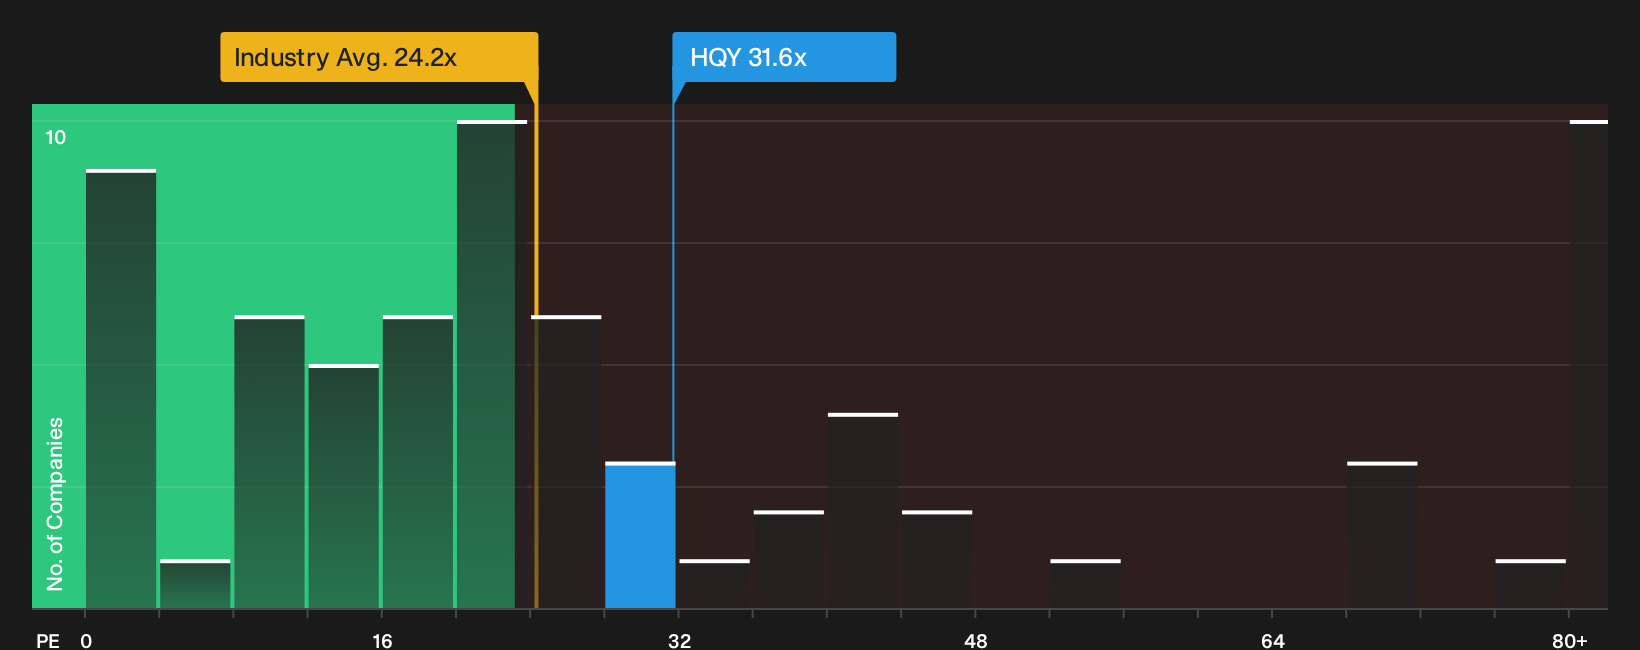
Analysts and the narrative point to HealthEquity trading below an estimated fair value, yet the current P/E of 31.6x tells a different story. That ratio is higher than the estimated fair ratio of 26.5x, the US Healthcare industry at 24.2x, and peers at 29.5x. This signals less margin for error if growth or profitability disappoint.
When a stock screens cheap on one model but expensive on earnings compared with its sector and closest competitors, investors are really weighing which signal to trust more at the moment.
See what the numbers say about this price — find out in our valuation breakdown.
Next Steps
Curious whether the mixed messages around HealthEquity point to opportunity or just noise in the data? Move quickly, review the drivers yourself, and weigh them against the 4 key rewards.
Looking for more investment ideas beyond HealthEquity?
If HealthEquity has your interest, do not stop there. Broaden your watchlist now so you are not relying on a single story to carry your portfolio.
- Target stability first by scanning a 30 resilient stocks with low risk scores that filters for businesses with resilient fundamentals and lower risk profiles.
- Hunt for quality on sale through a curated 30 high quality undervalued stocks that blends solid cash flows with balance sheets that already look robust.
- Spot tomorrow’s potential standouts early with a focused 16 high quality undiscovered gems that highlights strong fundamentals before they hit the mainstream radar.
This article by Simply Wall St is general in nature. We provide commentary based on historical data and analyst forecasts only using an unbiased methodology and our articles are not intended to be financial advice. It does not constitute a recommendation to buy or sell any stock, and does not take account of your objectives, or your financial situation. We aim to bring you long-term focused analysis driven by fundamental data. Note that our analysis may not factor in the latest price-sensitive company announcements or qualitative material. Simply Wall St has no position in any stocks mentioned.
Have feedback on this article? Concerned about the content? Get in touch with us directly. Alternatively, email editorial-team@simplywallst.com