


Nebius Group (NBIS) has just been added to the FTSE All-World Index, an inclusion that can influence index-tracking fund flows and sharpen institutional attention on the AI infrastructure specialist.
Nebius Group’s share price has had a choppy few months, with a 1-day share price return of down 4.03% and a 90-day return of down 5.70%. However, the year-to-date share price return of 151.93% and 1-year total shareholder return of 109.94% point to strong momentum that recent index inclusion, pricing changes and partnership news have kept firmly in focus.
Scan Nebius Group’s peers riding the same AI infrastructure wave and see how it stacks up against 85 AI infrastructure stocks in terms of scale, growth profile, and market attention.
Nebius Group now sits at the intersection of blockbuster AI momentum, a fresh FTSE All-World listing, vocal short interest and a still hot pricing story. Is most of the upside already spent, or is the rerating only getting started?
Most Popular Narrative: 19% Undervalued
The most followed narrative on Nebius Group pitches a fair value well above the last close at $226.61. This puts the spotlight squarely on how much growth the current price already assumes.
Nebius Group (NBIS) placed itself in the center of AI data center infrastructure bull run. If AWS is Walmart, Nebius is a boutique for the AI industry. It is specialized in AI Neocloud.
See why 10 investors see Nebius Group as 19% undervalued.
Result: Fair Value of $280 (UNDERVALUED)
Still, the Nebius Group story can be knocked off course if AI cloud demand cools faster than expected or if larger hyperscalers aggressively replicate its infrastructure model.
Find out about the key risks to this Nebius Group narrative.
Another View: Nebius Group Looks Expensive On Sales
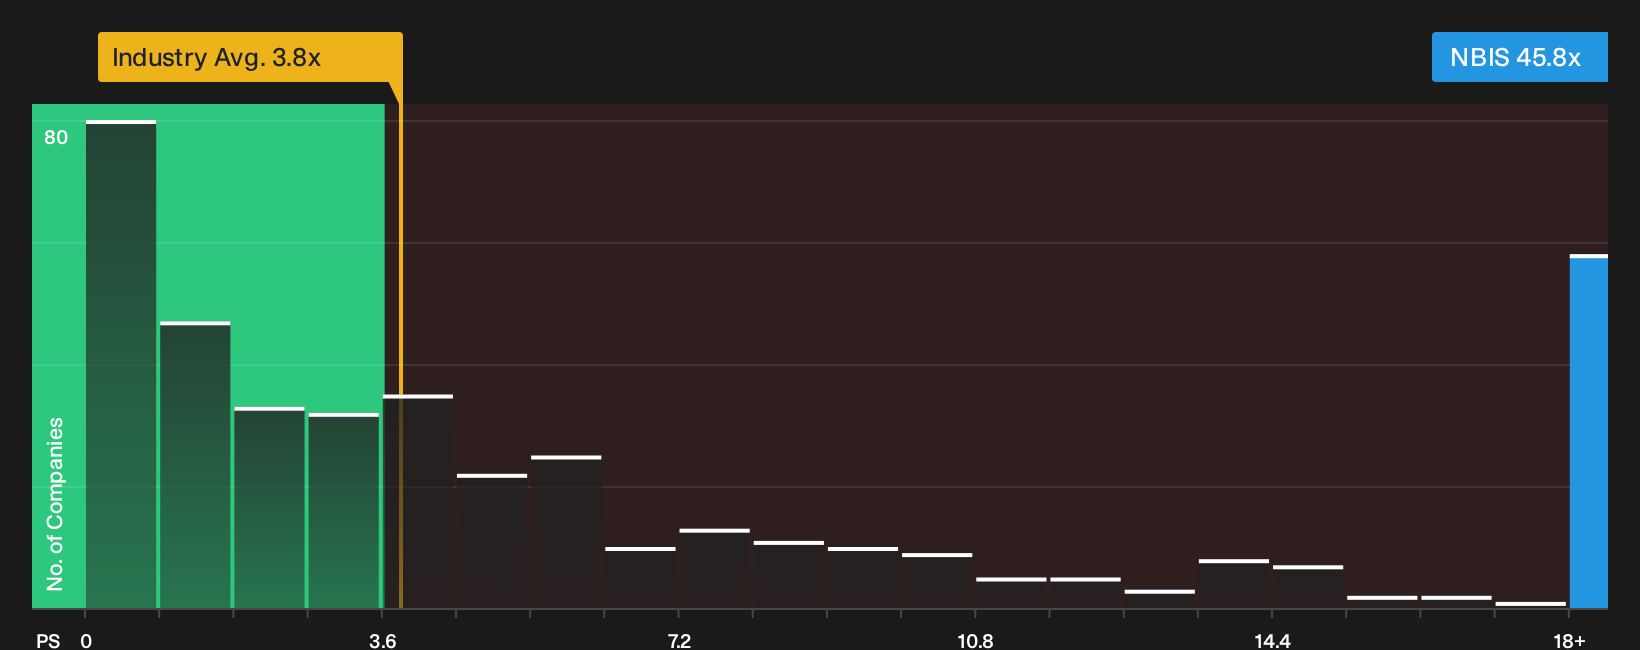
The most followed Nebius Group narrative leans on future earnings and growth forecasts. A different lens uses today’s P/S ratio of 45.8x versus a fair ratio of 38.1x, the US Software average of 3.8x and the peer average of 10.2x. That gap points to rich expectations. How comfortable are you paying that kind of premium?
For investors weighing what this premium might mean if sentiment cools or growth disappoints, See what the numbers say about this price — find out in our valuation breakdown.
Next Steps
If the split between bullish and cautious views on Nebius Group feels sharp, that is the point. Move quickly, review the numbers, and weigh both the potential upside and the open questions for yourself with 1 key reward and 4 important warning signs.
Looking for more Nebius Group sized ideas?
You have seen how split opinion on Nebius Group can be. Do not stop here, because the next pick that fits your style might already be waiting.
- Target potential mispricing by scanning companies that combine quality fundamentals with lower valuations through the 30 high quality undervalued stocks.
- Lock in income-focused ideas by reviewing income payers that feature in the 7 dividend fortresses.
- Prioritise resilience by filtering for businesses with robust finances using the list of solid balance sheet and fundamentals (23 results).
This article by Simply Wall St is general in nature. We provide commentary based on historical data and analyst forecasts only using an unbiased methodology and our articles are not intended to be financial advice. It does not constitute a recommendation to buy or sell any stock, and does not take account of your objectives, or your financial situation. We aim to bring you long-term focused analysis driven by fundamental data. Note that our analysis may not factor in the latest price-sensitive company announcements or qualitative material. Simply Wall St has no position in any stocks mentioned.
Have feedback on this article? Concerned about the content? Get in touch with us directly. Alternatively, email editorial-team@simplywallst.com