


Genworth Financial has delivered a powerful 5 year share price run, and the question now is whether the current valuation is properly supported by the insurer's earnings profile. With investors weighing both its legacy long term care exposure and newer product moves, the core issue is how much of that story is already reflected in the stock.
- Over the past 5 years, Genworth Financial has returned 157.5%, which puts real pressure on today’s buyers to judge whether the earnings picture can justify paying up after such a long climb.
- Genworth's newly introduced Family Caregiver Benefit for certain long term care policyholders may support expectations for how the business earns and retains premiums over time, as benefits flexibility can influence both claim behavior and the perceived value of coverage.
- There is a second opinion on Genworth Financial worth weighing. See what analysts think Genworth Financial's shares could be worth.
The issue now is whether Genworth Financial's current share price is justified by its earnings when set against the broader industry average.
If you are weighing Genworth Financial's 5 year run against its earnings today, it can help to compare that story with a wider set of 30 high quality undervalued stocks.
Is Genworth Financial Getting Expensive on Earnings?
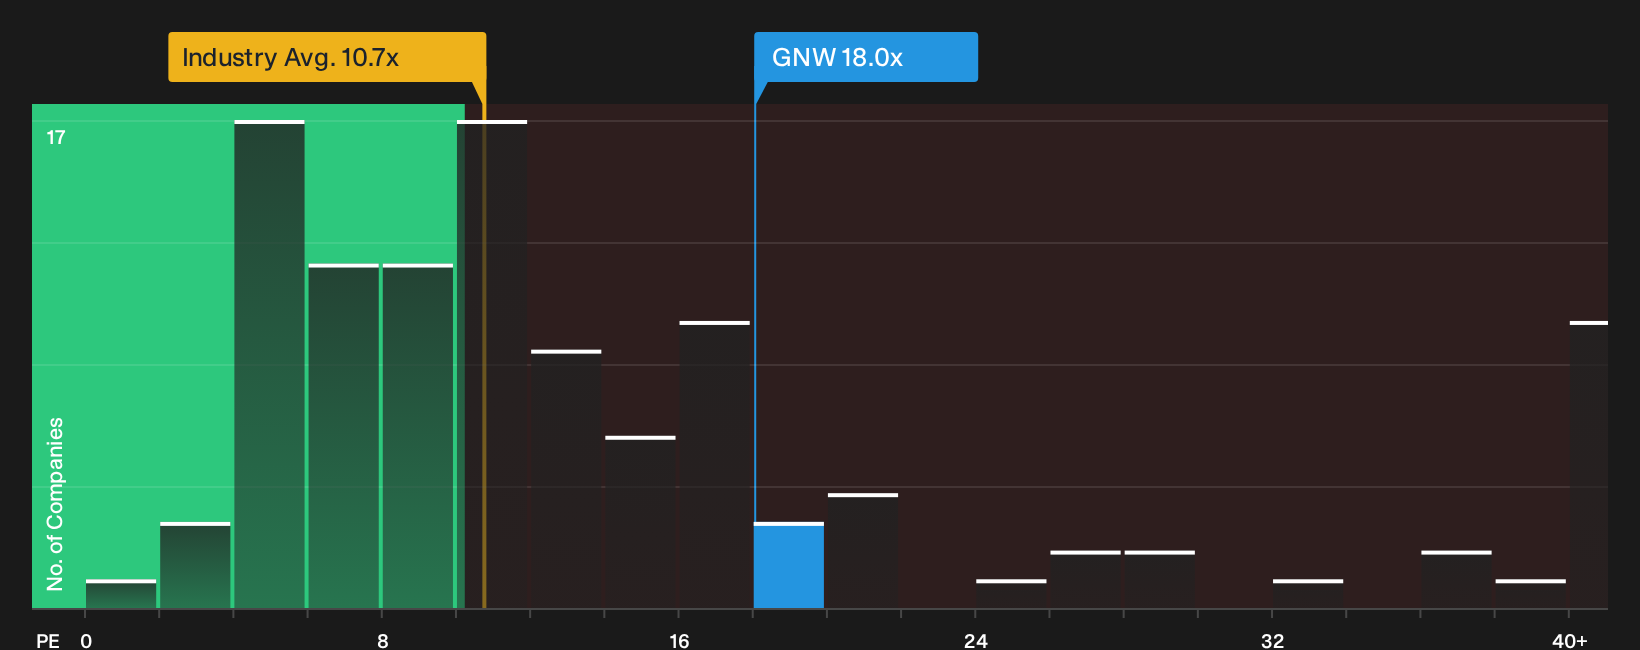
The P/E ratio is a useful starting point for Genworth Financial because earnings are a central reference point for valuing an insurer. On this measure, the stock trades on about 18.0x current earnings, which is meaningfully higher than the Insurance industry average of roughly 10.7x and above a peer group near 9.9x. That gap indicates the market is willing to pay a richer price for each dollar of Genworth Financial’s profit compared with many other insurers.
Because the Family Caregiver Benefit points to product changes in long term care, the elevated multiple suggests investors are already assigning some value to these moves and to the existing earnings stream. For anyone considering the shares today, the key question is whether the risk profile, long term care exposure and cash generation justify paying a premium multiple relative to the sector. Explore the numbers behind Genworth Financial's P/E valuation.
The Genworth Financial Narrative: What Would Justify Today's Price?
Simply Wall St Narratives for Genworth Financial pick up where the P/E puzzle leaves off, by spelling out what would need to happen to the insurer's future growth, margins and earnings path for the stock to be worth materially more or less than it is today on the market. Each narrative sets out Genworth Financial's fair value as a thesis about how the business might play out over time, so you can watch how that line of thinking holds up as new information arrives on the Community page.
A written, number driven narrative on Genworth Financial gives you a clear reference point for how the higher P/E and the long term care mix, including the new Family Caregiver Benefit, stack up against the insurer's actual profit delivery over time. Putting those assumptions on paper creates a roadmap you can revisit as new regulatory approvals, product uptake and earnings data arrive.
Share your own Narrative for Genworth Financial and set out the assumptions behind your valuation.
Genworth Financial's valuation still hinges on who is steering the ship
Price multiples only tell part of the story, because the people setting priorities, taking risk decisions and rewarding themselves can tilt outcomes in ways the numbers alone never show. See who runs Genworth Financial and how they are paid.
This article by Simply Wall St is general in nature. We provide commentary based on historical data and analyst forecasts only using an unbiased methodology and our articles are not intended to be financial advice. It does not constitute a recommendation to buy or sell any stock, and does not take account of your objectives, or your financial situation. We aim to bring you long-term focused analysis driven by fundamental data. Note that our analysis may not factor in the latest price-sensitive company announcements or qualitative material. Simply Wall St has no position in any stocks mentioned.
Have feedback on this article? Concerned about the content? Get in touch with us directly. Alternatively, email editorial-team@simplywallst.com