


NANKAI Co., Ltd. (TSE:9044) has been removed from the FTSE All-World Index in USD terms, a change that can trigger mechanical selling or buying as index-tracking funds adjust their holdings.
Recent trading suggests investors are still digesting this index change. NANKAI’s share price is ¥3,244 with a 90-day share price return of 15.42%, while the 1-year total shareholder return of 17.86% points to momentum that has been building rather than fading.
Scan how other rail and transport related stocks are reacting to index reshuffles and capital flows by reviewing the curated list of solid balance sheet and fundamentals (22 results) alongside NANKAI today.
With NANKAI trading near ¥3,244 after a strong 1-year run and index-related flows in the mix, is most of the easy upside already behind the stock or does the valuation still leave room ahead?
Price-to-Earnings of 13.8x: Is it justified?
NANKAI now trades on a P/E of 13.8x, slightly below the broader JP market but above the transportation peer average, which hints at a modest premium baked into the current ¥3,244 share price.
The P/E multiple compares what investors are willing to pay today for each unit of current earnings. For a rail and transport focused group like NANKAI, where demand and capital needs can be relatively steady, earnings based measures often carry more weight than revenue only metrics.
On one hand, the stock is described as good value versus the JP market, with its 13.8x P/E sitting just under the estimated fair P/E of 14.3x. This indicates the current tag is close to what the market could gravitate toward if sentiment normalises. On the other hand, the same 13.8x level is higher than both the JP Transportation industry average and the identified peer group average of 12.2x, which signals investors are willing to pay more than they do for similar rail and transport operators.
Compared with that 12.2x industry and peer benchmark, the P/E gap is clear and not trivial. The market is effectively pricing NANKAI above sector norms while only slightly below its own fair ratio, which points to a valuation that leans richer than direct competitors rather than outright cheap.
Explore the SWS fair ratio for NANKAI.
Result: Price-to-Earnings of 13.8x (ABOUT RIGHT)
Still, NANKAI’s heavy tilt to Japan and reliance on transportation earnings leaves the story exposed if domestic demand or regulatory conditions shift unexpectedly.
Find out about the key risks to this NANKAI narrative.
Another View on NANKAI’s Value
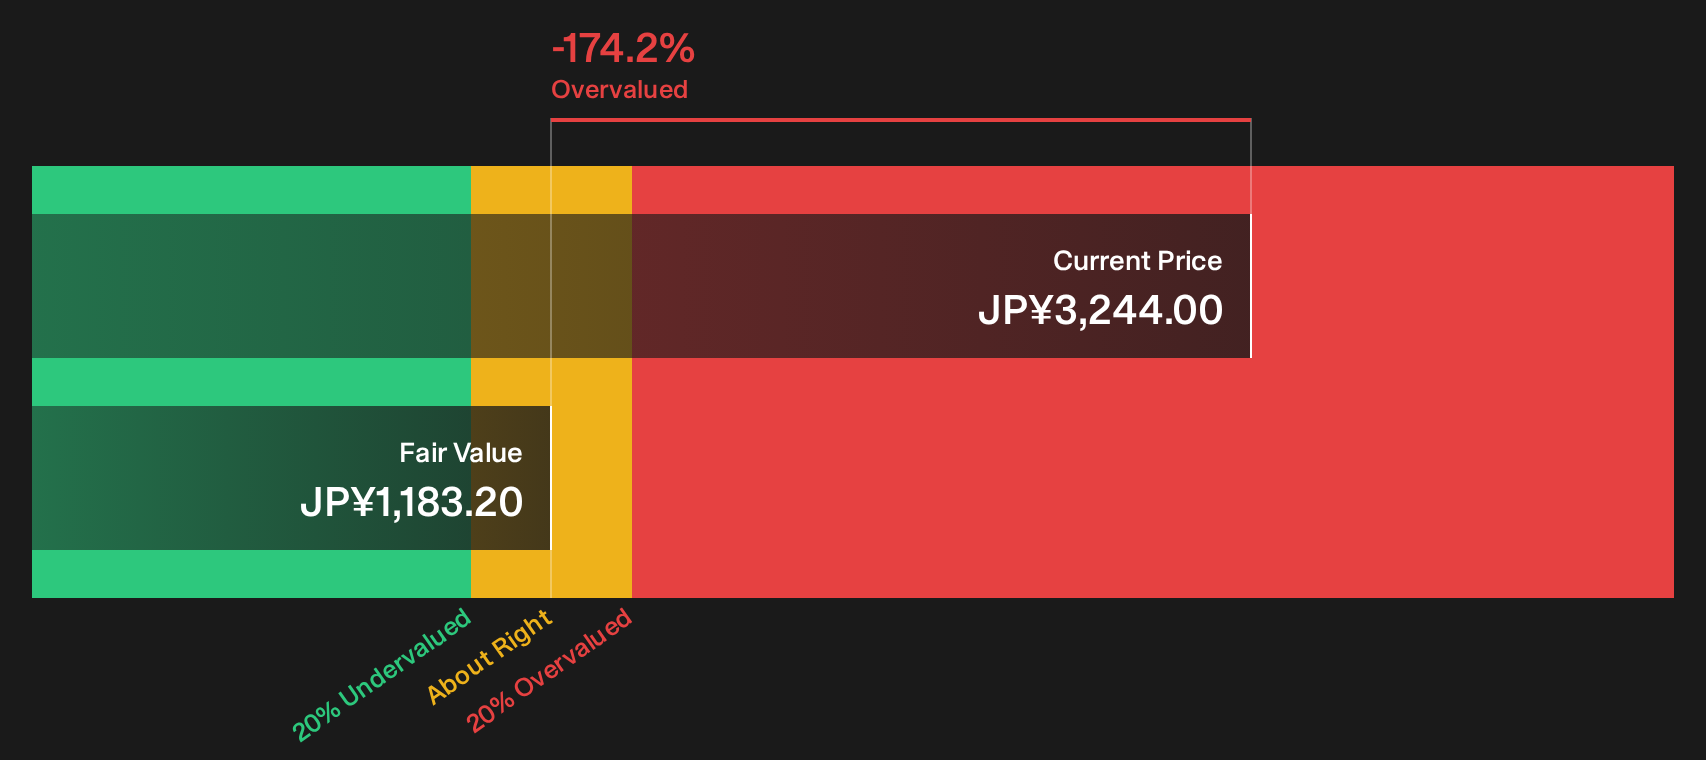
The P/E discussion presents NANKAI as roughly fairly priced, but the SWS DCF model offers a different perspective. On that cash flow view, the estimated value is ¥1,183.2 compared with a share price around ¥3,244, which frames the stock as materially overvalued. Which lens do you trust more when you are risking your own capital?
Look into how the SWS DCF model arrives at its fair value.
Simply Wall St performs a discounted cash flow (DCF) on every stock in the world every day (check out NANKAI for example). We show the entire calculation in full. You can track the result in your watchlist or portfolio and be alerted when this changes, or use our stock screener to discover 18 high quality undervalued stocks. If you save a screener we even alert you when new companies match - so you never miss a potential opportunity.
Next Steps
Mixed signals on NANKAI’s price and fair value make this a judgment call. Move quickly, review the underlying data, and weigh both the upside and the downside using the 3 key rewards and 1 important warning sign.
Looking for more NANKAI sized investment ideas?
Do not stop your research with NANKAI. Use curated screeners to hunt for fresh ideas that match your risk tolerance, income needs, and return expectations.
- Target potential value opportunities by scanning companies screened as quality yet overlooked through the 18 high quality undervalued stocks.
- Strengthen your focus on resilient balance sheets by filtering for businesses with steady fundamentals through the list of solid balance sheet and fundamentals (22 results).
- Spot potential up and comers with stronger financial profiles by reviewing the 1 elite penny stocks with strong financials before they attract wider attention.
This article by Simply Wall St is general in nature. We provide commentary based on historical data and analyst forecasts only using an unbiased methodology and our articles are not intended to be financial advice. It does not constitute a recommendation to buy or sell any stock, and does not take account of your objectives, or your financial situation. We aim to bring you long-term focused analysis driven by fundamental data. Note that our analysis may not factor in the latest price-sensitive company announcements or qualitative material. Simply Wall St has no position in any stocks mentioned.
Have feedback on this article? Concerned about the content? Get in touch with us directly. Alternatively, email editorial-team@simplywallst.com