


Universal Display has seen a sharp reset in its share price over recent years, and that puts a spotlight on whether the current valuation still lines up with what the business earns. With the stock now trading at US$77.39, the key issue for investors is how that price stacks up against the earnings power behind the ticker.
- Over the past 5 years, Universal Display shares have fallen 52.2%. This puts the focus squarely on whether the market has reassessed the earnings profile or gone too far in marking the stock down.
- The planned launch of the NovaJet system by subsidiary Universal Vapor Jet Corporation in October 2026 may support expectations for future earnings if the technology gains traction with semiconductor manufacturers and translates into profitable contracts over time.
- The analysts covering Universal Display have run their own numbers. See what analysts think Universal Display's shares could be worth.
The issue now is whether Universal Display's current share price is justified by its earnings when measured against the Fair Ratio benchmark.
If you are weighing Universal Display against other potential ideas, a focused stock screen built around 30 high quality undervalued stocks can be a useful next step in your research.
Is Universal Display Still Cheap on Earnings?
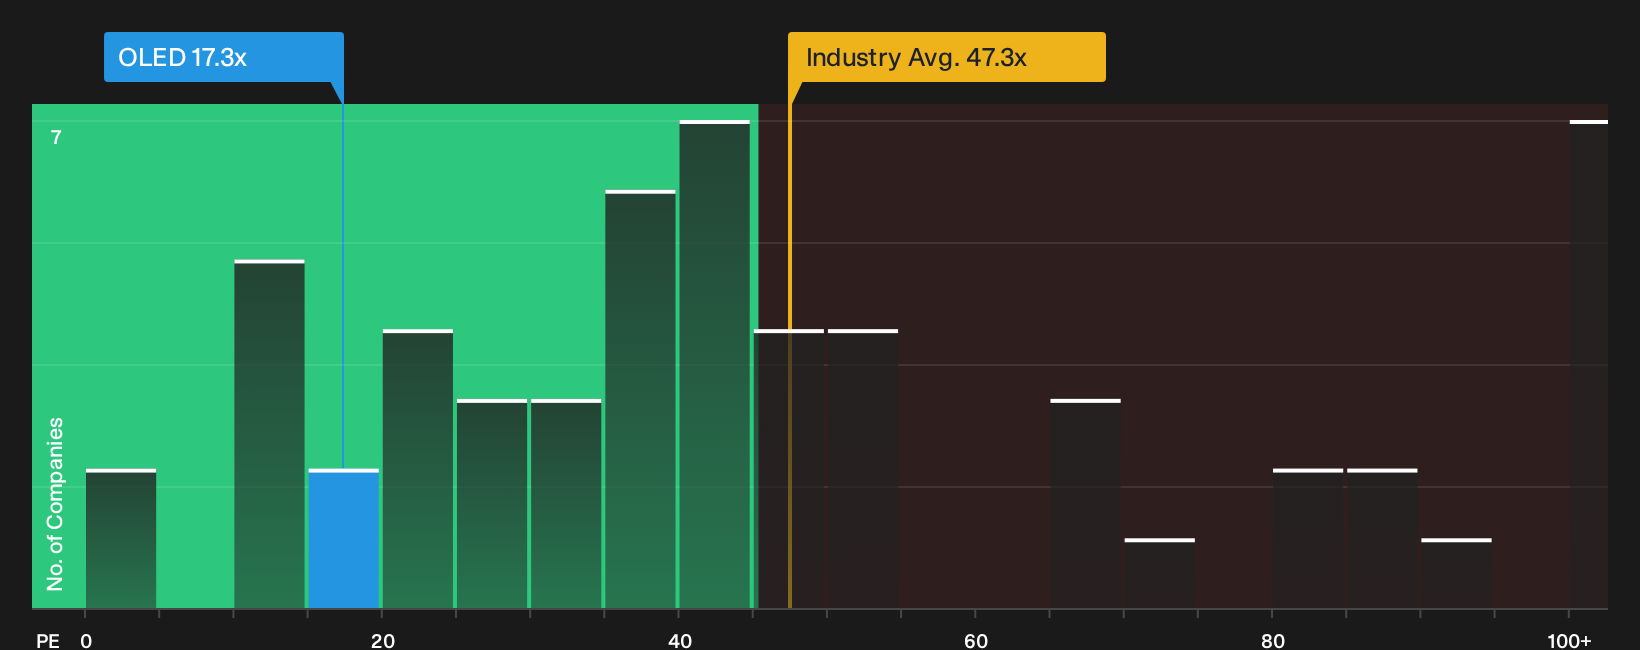
A P/E ratio is a useful way to look at Universal Display because earnings are a central driver of how investors usually think about this business. At a current P/E of roughly 18.2x, the stock changes hands at a lower earnings multiple than the broader semiconductor industry, where the average is about 47.3x, and also below a peer group average of roughly 54.9x. In that context, the Fair Ratio model, which looks at factors like growth profile, margins, size and risk, points to a higher earnings multiple than the one the market is currently paying, which flags the shares as undervalued on this specific lens.
Because the upcoming NovaJet launch has drawn attention to Universal Display’s technology pipeline, some investors might expect the valuation to already incorporate a premium. However, the current P/E still reflects a discount to both sector and peer benchmarks. That gap indicates that the current share price does not fully reflect what this framework suggests the earnings stream could warrant if the business delivers in line with the assumptions behind the Fair Ratio. Explore the numbers behind Universal Display's P/E valuation.
The Universal Display Narrative: What Would Justify Today's Price?
Narratives for Universal Display provide a clear bridge from the valuation puzzle to the underlying assumptions. They explain what would need to happen to growth, profitability and earnings for the stock to be worth materially more or less than today’s price. Each scenario links its figures to a specific view on where expansion, margins and risks could move next. You can revisit these views as new information appears on Simply Wall St’s Community page.
One of the top community narratives on Universal Display: 33% undervalued
"Universal Display's successful commercialization of phosphorescent blue OLED technology, verified at mass production scale, is set to unlock a major leap in display energy efficiency…"
Discover why this Narrative puts Universal Display at 33% undervalued.
Before acting on Universal Display's valuation, look at who is steering the ship
Price multiples only tell part of the story for Universal Display. The track record, incentives and pay structure of the leadership team can heavily shape how those numbers evolve over time. See who runs Universal Display and how they are paid.
This article by Simply Wall St is general in nature. We provide commentary based on historical data and analyst forecasts only using an unbiased methodology and our articles are not intended to be financial advice. It does not constitute a recommendation to buy or sell any stock, and does not take account of your objectives, or your financial situation. We aim to bring you long-term focused analysis driven by fundamental data. Note that our analysis may not factor in the latest price-sensitive company announcements or qualitative material. Simply Wall St has no position in any stocks mentioned.
Have feedback on this article? Concerned about the content? Get in touch with us directly. Alternatively, email editorial-team@simplywallst.com