


Sumitomo Mitsui Financial Group (TSE:8316) moved back into focus after reporting Q1 FY27 earnings per share of ¥131.62, ahead of estimates, together with a declared cash dividend of ¥90.00 per share.
The latest move takes Sumitomo Mitsui Financial Group’s share price to ¥6,919, with a 1-day share price return of 3.59% and a 90-day share price return of 9.06%, pointing to building momentum on top of a 1-year total shareholder return of 68.66% and a very large 5-year total shareholder return that is more than 5x.
Scan how Sumitomo Mitsui Financial Group compares with other financially solid opportunities by reviewing our hand picked list of solid balance sheet and fundamentals (22 results) in the market right now.
Sumitomo Mitsui Financial Group has just delivered a strong run, backed by an earnings beat and a fresh ¥90.00 dividend. The real tension now is simple: Does buying after this jump still make sense, or does patience win?
Price-to-Earnings of 20.6x: Is it justified?
Valuation is no longer cheap on the headline numbers. Sumitomo Mitsui Financial Group now trades on a P/E of 20.6x at a last close of ¥6,919, which screens as expensive against several benchmarks, even though some models still suggest upside.
The P/E ratio compares the current share price with earnings per share. For a large Japanese bank like Sumitomo Mitsui Financial Group, this multiple often reflects how much investors are willing to pay today for each unit of current profit, given expectations for future earnings, dividend reliability and perceived risk.
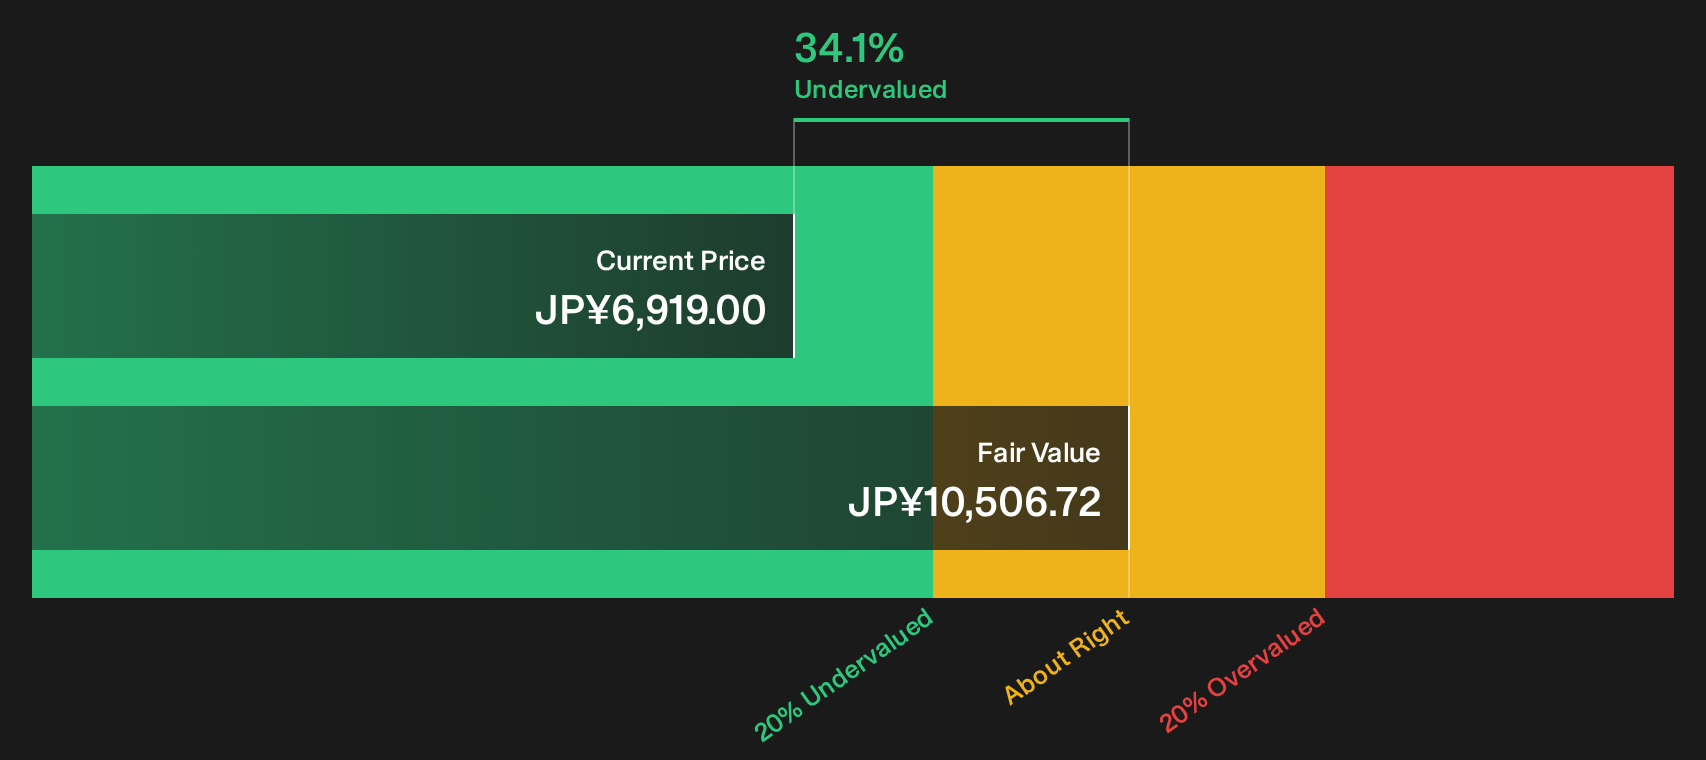
Here, the P/E of 20.6x is described as above an estimated fair P/E of 20.3x. That suggests the market is paying a premium to the level some regression based models might move toward over time, even as those same assessments point to the shares trading 34.1% below an internal fair value estimate based on future cash flows at ¥10,506.72.
Against peers, the gap is clearer. The P/E of 20.6x is labelled expensive relative to the JP Banks industry average of 16x and also above a peer group average of 17.4x, which indicates investors are already assigning richer terms to Sumitomo Mitsui Financial Group compared with sector and peer benchmarks.
Explore the SWS fair ratio for Sumitomo Mitsui Financial Group.
Result: Preferred multiple of 20.6x price-to-earnings (OVERVALUED).
Still, the story can turn quickly if Sumitomo Mitsui Financial Group faces pressure on loan profitability or if credit losses rise from current levels.
Find out about the key risks to this Sumitomo Mitsui Financial Group narrative.
Another view on Sumitomo Mitsui Financial Group’s value
The SWS DCF model offers a different perspective. On this view, Sumitomo Mitsui Financial Group at ¥6,919 is trading about 34.1% below an estimated future cash flow value of ¥10,506.72, which indicates potential upside. Which signal appears more convincing to you: earnings multiple or cash flows?
Look into how the SWS DCF model arrives at its fair value.
Simply Wall St performs a discounted cash flow (DCF) on every stock in the world every day (check out Sumitomo Mitsui Financial Group for example). We show the entire calculation in full. You can track the result in your watchlist or portfolio and be alerted when this changes, or use our stock screener to discover 19 high quality undervalued stocks. If you save a screener we even alert you when new companies match - so you never miss a potential opportunity.
Next Steps
Mixed signals on Sumitomo Mitsui Financial Group so far, right? If you want to move fast and build your own conviction, weigh both the upside and downside by reviewing the 4 key rewards and 1 important warning sign
Looking for more Sumitomo Mitsui Financial Group sized ideas?
If Sumitomo Mitsui Financial Group has sharpened your focus, do not stop here. The screener tools can help surface fresh ideas before the crowd reacts.
- Target steadier opportunities by reviewing a curated 21 resilient stocks with low risk scores that may suit investors who prefer fewer surprises and more predictable business profiles.
- Hunt for quality at a discount by using a focused 19 high quality undervalued stocks that highlights companies with strong fundamentals priced below internal estimates.
- Stack potential income ideas by scanning a hand picked 14 dividend fortresses that could complement capital growth with regular cash returns.
This article by Simply Wall St is general in nature. We provide commentary based on historical data and analyst forecasts only using an unbiased methodology and our articles are not intended to be financial advice. It does not constitute a recommendation to buy or sell any stock, and does not take account of your objectives, or your financial situation. We aim to bring you long-term focused analysis driven by fundamental data. Note that our analysis may not factor in the latest price-sensitive company announcements or qualitative material. Simply Wall St has no position in any stocks mentioned.
Have feedback on this article? Concerned about the content? Get in touch with us directly. Alternatively, email editorial-team@simplywallst.com