


- Cathay Pacific Airways reported unaudited August 2026 traffic figures, including 13,199,357,000 available seat kilometres, 11,513,341,000 revenue passenger kilometres and an 87.2% passenger load factor.
- The combination of high passenger load factors across Cathay Pacific and HK Express, together with a 57.4% cargo load factor, gives investors a clearer view of how current capacity is being absorbed.
- We will now look at how Cathay Pacific Airways' investment narrative is influenced by these August load factors and traffic metrics.
See how Cathay Pacific Airways’ August load factors compare with peers that also have significant passenger and cargo exposure by checking our curated list of list of solid balance sheet and fundamentals (202 results)
Cathay Pacific Airways Investment Narrative Recap
For Cathay Pacific Airways, the core belief for any shareholder is that high passenger and cargo utilisation can support disciplined capacity growth without eroding profitability. August’s 87.2% passenger load factor at Cathay and 83.9% at HK Express, alongside a 57.4% cargo load factor, point to capacity being well used rather than left idle.
The near term swing factor is whether demand holds up as the group keeps flying more seats and freight tonnes. If future supply runs ahead of bookings, yields could come under pressure. The biggest operational risk remains overexpansion into a market where cargo pricing or international travel appetite weakens.
The August 2026 traffic update is the clearest recent data point tying directly into those catalysts. It shows 13.2b available seat kilometres and 11.5b revenue passenger kilometres for Cathay Pacific, with 2.8m passengers carried, while the cargo arm moved 151,904,000 kg on 1.37b available freight tonne kilometres.
HK Express added 1.76b available seat kilometres and carried 796,074 passengers at an 83.9% load factor. For investors, this monthly snapshot helps test whether the ongoing fleet investment and network build out are being absorbed efficiently, or whether capacity additions risk outpacing demand and putting pressure on future returns.
Cathay Pacific Airways Forecasts and Valuation Anchors
The current narrative for Cathay Pacific Airways sets out projected revenue of HK$148.9b and earnings of HK$12.9b by 2029. These figures are based on analysts' assumptions of 4.5% annual revenue growth and an earnings decline of HK$0.5b from HK$13.4b at present.
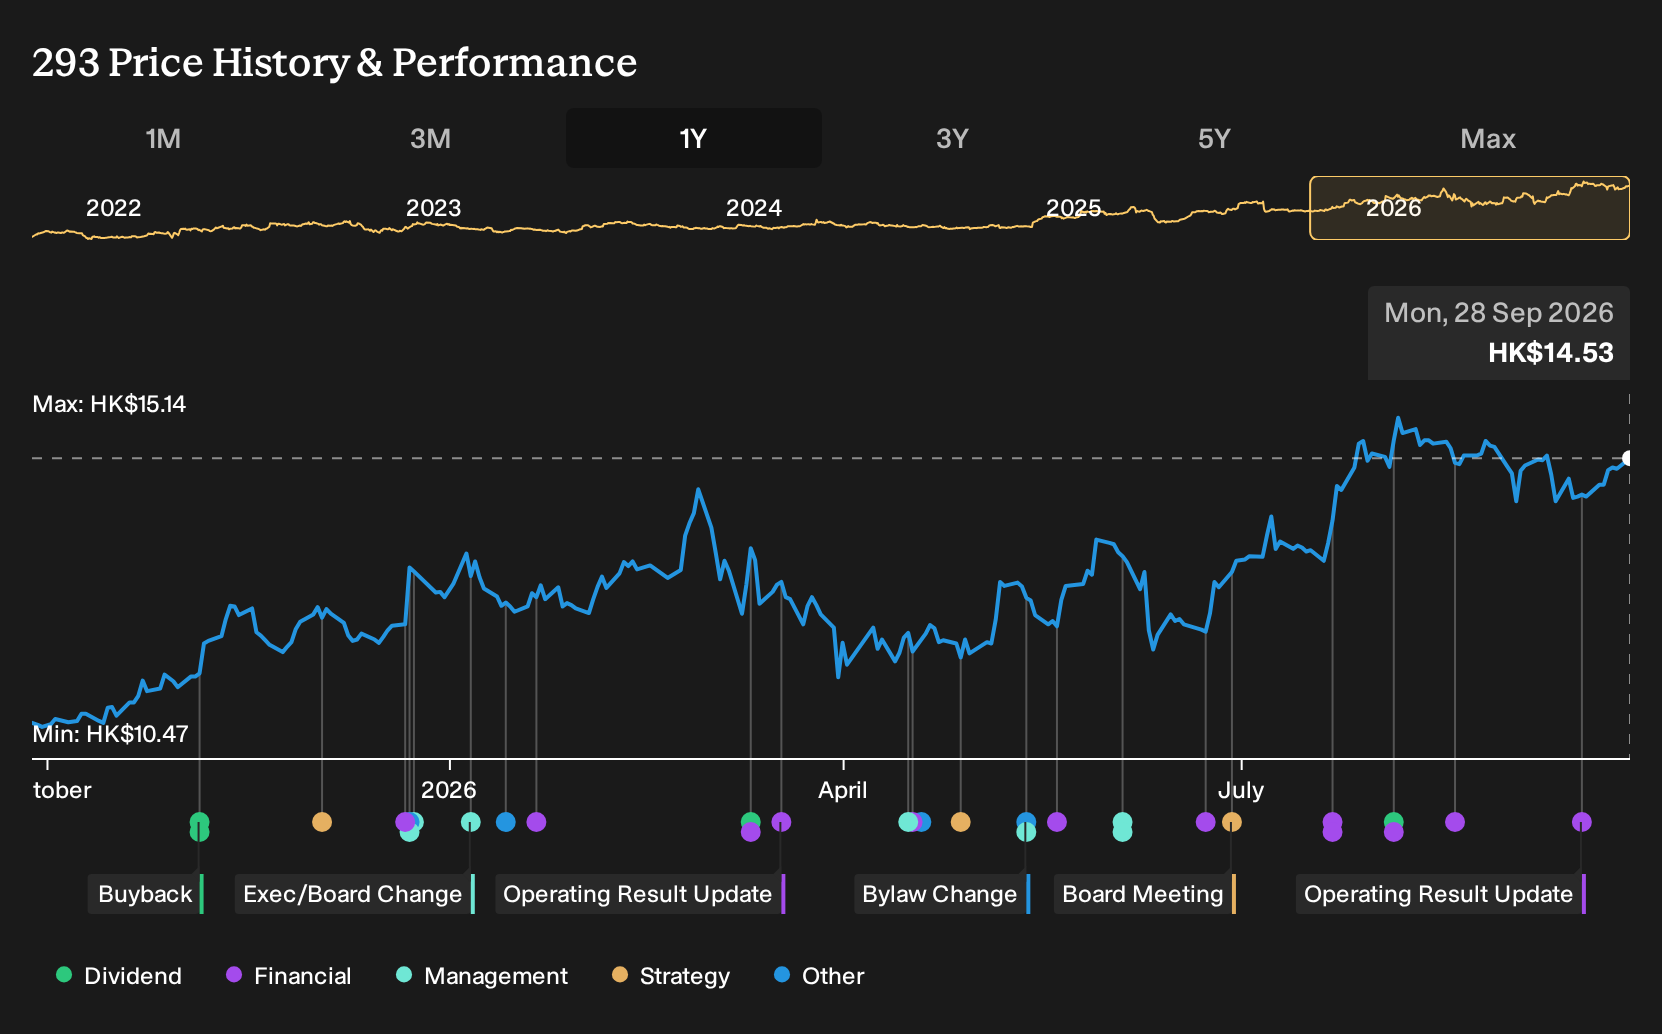
Uncover how Cathay Pacific Airways' fair value indicates an 11% potential upside to its current price before the market closes that gap.
Exploring Other Perspectives
One alternate view focuses on Cathay Pacific’s dependence on international travel. The most cautious analysts were modelling revenue of about HK$123.3b and earnings of HK$9.2b by 2029, well below consensus. Your takeaway is simple: opinions differ widely, and this August traffic update could shift those expectations again.
Explore 4 other Cathay Pacific Airways fair value estimates, including one that suggests there could be as much as 20% downside from the current price.
The Verdict Is Yours
Don't just follow the ticker. Dig into the data and build a conviction that's truly your own.
- A great starting point for your Cathay Pacific Airways research is our analysis highlighting 3 key rewards and 2 important warning signs that could impact your investment decision.
- See our latest analysis for Cathay Pacific Airways. The report includes a comprehensive fundamental analysis summarized in a single visual, the Snowflake, making it easy to evaluate Cathay Pacific Airways' overall financial health at a glance.
Looking For More Investment Ideas Beyond Cathay Pacific Airways?
If the Cathay Pacific Airways story has sharpened your thinking on capacity, pricing power and balance sheet strength, use that same lens to scan the wider market with the Simply Wall St Screener.
- For investors who want quality at a discount, start with companies that screen as attractively priced relative to fundamentals through our 197 high quality undervalued stocks.
- If income is your priority, focus on businesses with resilient cash flows and payouts by scanning our 165 dividend fortresses.
- When capital preservation matters most, concentrate on financially robust businesses by checking the 221 resilient stocks with low risk scores.
This article by Simply Wall St is general in nature. We provide commentary based on historical data and analyst forecasts only using an unbiased methodology and our articles are not intended to be financial advice. It does not constitute a recommendation to buy or sell any stock, and does not take account of your objectives, or your financial situation. We aim to bring you long-term focused analysis driven by fundamental data. Note that our analysis may not factor in the latest price-sensitive company announcements or qualitative material. Simply Wall St has no position in any stocks mentioned.
Have feedback on this article? Concerned about the content? Get in touch with us directly. Alternatively, email editorial-team@simplywallst.com