


Aon (AON) has put energy risk squarely in focus with its new Power Lifecycle Program, an integrated insurance solution that tracks conventional gas power projects from site selection through early operations.
Recent price action tells a different story to the product headlines. Aon’s share price has fallen 23.4% over the past 30 days and is down 21.0% year to date, while the 1 year total shareholder return is lower by 22.6%. This suggests momentum has been fading even as the Power Lifecycle Program launch, new leadership appointments and fresh credit facilities refocus attention on the business.
Scan beyond Aon and this single product launch to compare it with 84 AI infrastructure stocks that are also tied to the build out of data centers and digital power demand.
Aon’s sharp share price reset may be pointing to real concern about the business, or it may simply reflect a swing in sentiment. The valuation numbers now on screen need to be tested against the fundamentals.
Most Popular Narrative: 28.6% Undervalued
Aon’s most followed valuation story points to a fair value of $381 per share compared with the last close at $272.10, which puts the recent sell off in a different light for anyone focused on long term cash flows rather than short term sentiment.
The analysts have a consensus price target of $381.0 for Aon based on their expectations of its future earnings growth, profit margins and other risk factors.
However, there is a degree of disagreement amongst analysts, with the most bullish reporting a price target of $433.0, and the most bearish reporting a price target of $264.0.
See why 19 investors see Aon as 29% undervalued.
Result: Fair Value of $381 (UNDERVALUED)
Still, Aon’s higher debt load from acquisitions and softer pricing in commercial risk lines could both undermine the upbeat valuation story if conditions remain difficult.
Find out about the key risks to this Aon narrative.
Another View: What Aon’s P/E Is Telling You
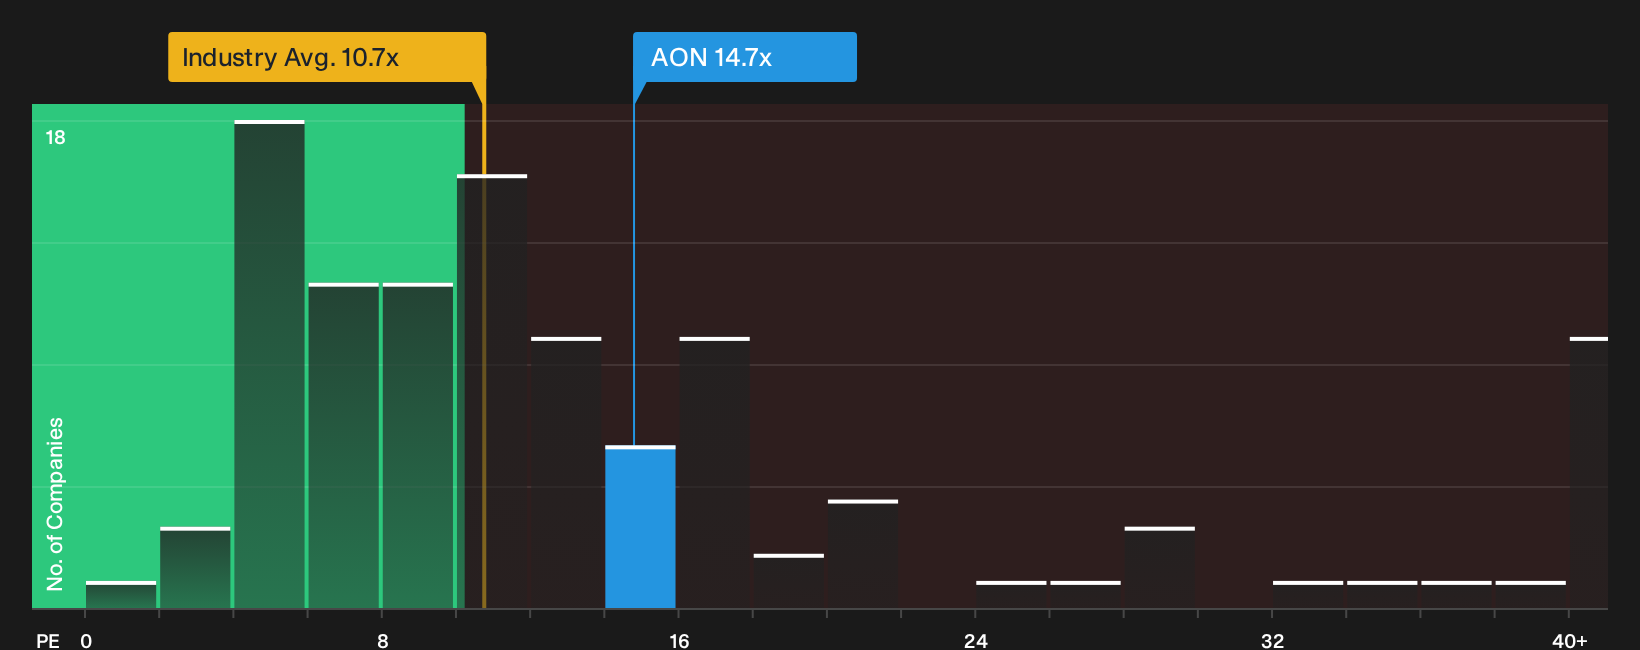
Aon screens as cheap on one lens and expensive on another. The stock trades on a P/E of 14.7x, which is lower than peers at 23x but higher than the wider US insurance group at 10.7x and above a fair ratio of 12.7x that the market could gravitate toward.
That mix points to some valuation risk if sector sentiment weakens, even if company specific fundamentals eventually support the higher peer style multiple. Which reference point matters more for you: the peer group or the industry baseline?
See what the numbers say about this price — find out in our valuation breakdown.
Next Steps
Mixed messages across Aon’s valuation and its recent price slump make this a good moment to review the data yourself and decide how much risk you are willing to take on. To see both sides of the story in one place, review the 3 key rewards and 1 important warning sign
Looking for more investment ideas beyond Aon?
If Aon has sharpened your focus on risk and reward, use that momentum and keep searching for opportunities that fit your own comfort level and goals.
- Target resilient balance sheets by scanning a list of solid balance sheet and fundamentals (25 results) that filters for companies pairing financial strength with more dependable fundamentals.
- Hunt for potential mispricing by running through a 32 high quality undervalued stocks that highlights stocks where quality and price might be out of sync.
- Build your income playbook by reviewing a 6 dividend fortresses that focuses on higher yielding businesses designed for investors who care about regular cash payouts.
This article by Simply Wall St is general in nature. We provide commentary based on historical data and analyst forecasts only using an unbiased methodology and our articles are not intended to be financial advice. It does not constitute a recommendation to buy or sell any stock, and does not take account of your objectives, or your financial situation. We aim to bring you long-term focused analysis driven by fundamental data. Note that our analysis may not factor in the latest price-sensitive company announcements or qualitative material. Simply Wall St has no position in any stocks mentioned.
Have feedback on this article? Concerned about the content? Get in touch with us directly. Alternatively, email editorial-team@simplywallst.com