


XTransfer’s new cooperation with China Zheshang Bank (SEHK:2016) puts cross-border settlement in focus for investors, as the lender leans on fintech to support exporters collecting minor-currency payments from emerging markets.
Recent trading shows some renewed interest in China Zheshang Bank, with a 1-day share price return of 2.14% and a 90-day share price return of 12.74% from a last close of HK$2.39. However, the year-to-date share price return is down 5.53%, while the 3-year total shareholder return of 46.12% points to stronger longer term momentum despite a 1-year total shareholder return that declined 1.62%.
Scan beyond China Zheshang Bank and this XTransfer tie up by reviewing exporters and financials with strong cross border potential in the 618 high quality undiscovered gems.
After that recent rebound and a mixed return profile, China Zheshang Bank now asks a simple question of investors: Does the current valuation still skew the risk and reward toward buyers?
Price-to-Earnings of 4.6x: Is it justified?
China Zheshang Bank trades on a P/E of 4.6x, while the last close sits at HK$2.39, which points to a valuation that looks modest next to both its peers and the wider Hong Kong Banks industry.
The P/E ratio links what you pay today to the bank’s current earnings power. For a lender like China Zheshang Bank, this multiple gives you a quick read on how the market is pricing its profit engine relative to other financial institutions.
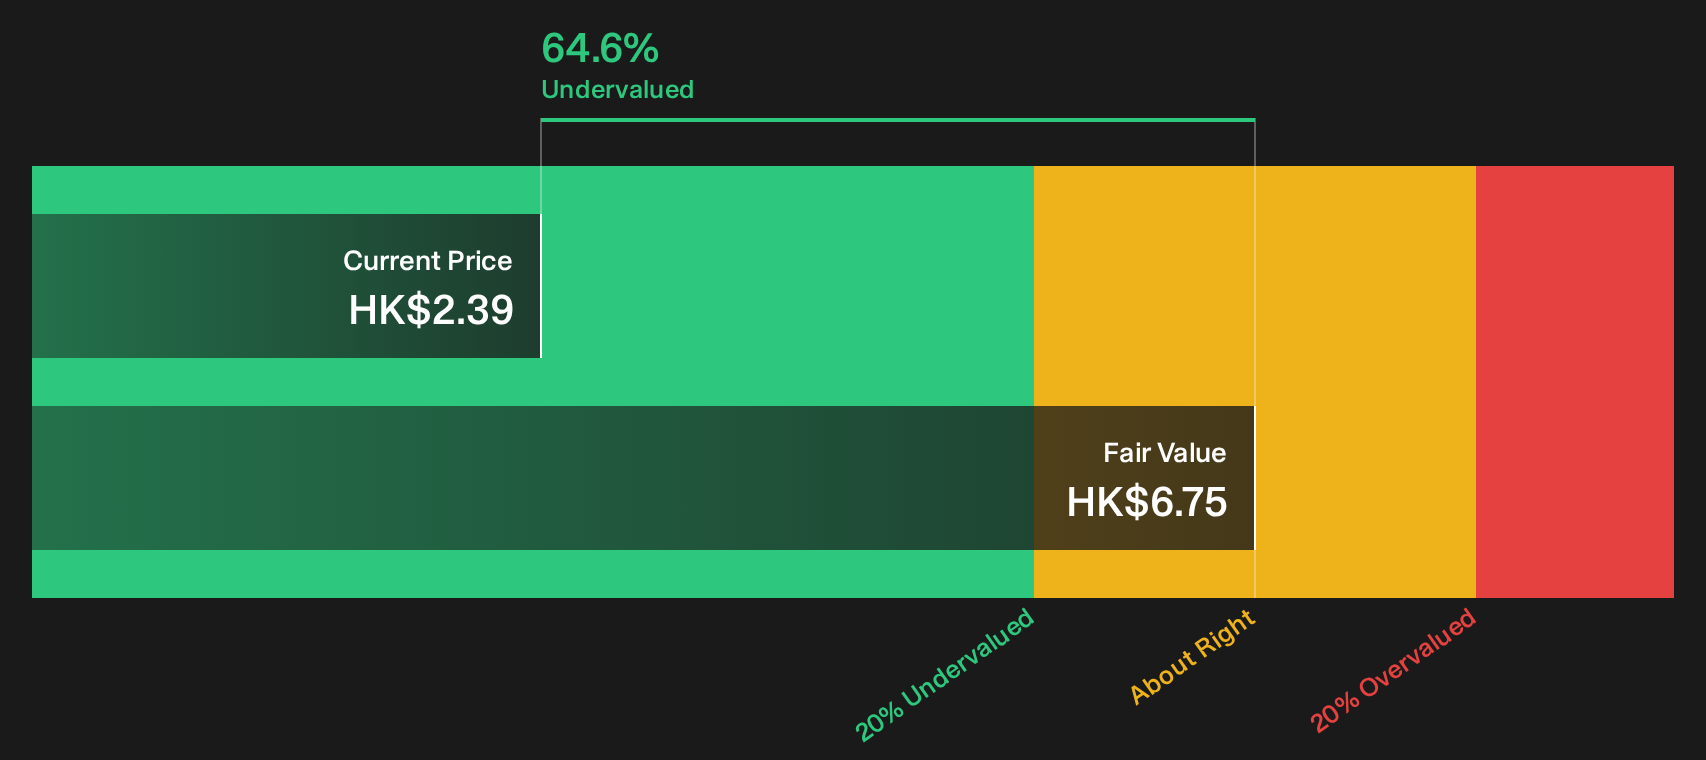
On one side, earnings have grown by 2.1% per year over the past 5 years, yet profit fell 12.7% over the last year and net profit margins eased from 35.5% to 31.4%. On the other side, the business is described as having high quality earnings and is trading 64.6% below the estimate of its fair value, with the SWS DCF model indicating a future cash flow value of HK$6.75 per share versus the current HK$2.39 price.
The P/E of 4.6x sits well below the peer average of 9.6x and also below the Hong Kong Banks industry average of 5.2x, which signals the market is assigning a clear discount to China Zheshang Bank compared to similar banks.
See what the numbers say about this price — find out in our valuation breakdown.
Result: Price-to-Earnings of 4.6x (UNDERVALUED)
Still, the narrative around China Zheshang Bank can change quickly if profit pressure persists or if cross border payment growth disappoints relative to current expectations.
Find out about the key risks to this China Zheshang Bank narrative.
Another View on China Zheshang Bank’s Value
The SWS DCF model points to a future cash flow value of HK$6.75 per share for China Zheshang Bank against the HK$2.39 market price, which suggests the stock screens as deeply undervalued on this second lens as well. The real question is how much faith you place in those long term cash flow assumptions.
Look into how the SWS DCF model arrives at its fair value.
Simply Wall St performs a discounted cash flow (DCF) on every stock in the world every day (check out China Zheshang Bank for example). We show the entire calculation in full. You can track the result in your watchlist or portfolio and be alerted when this changes, or use our stock screener to discover 202 high quality undervalued stocks. If you save a screener we even alert you when new companies match - so you never miss a potential opportunity.
Next Steps
If the mix of low P/E, discounted DCF and shifting returns around China Zheshang Bank leaves you on the fence, move quickly. Check the underlying data for yourself, then weigh the 1 key reward and 1 important warning sign highlighted in the 1 key reward and 1 important warning sign.
Want more ideas beyond China Zheshang Bank?
China Zheshang Bank may be on your radar, but some of the most interesting opportunities often sit just outside the obvious choices investors keep revisiting.
Use the Simply Wall St Screener to quickly spot fresh ideas, compare fundamentals side by side, and build a shortlist before the crowd catches on.
- Hunt for quality selling at a discount by scanning companies that pass strict valuation and fundamentals filters in the 202 high quality undervalued stocks.
- Lock in potential income ideas by sorting for payout strength and consistency across the 164 dividend fortresses.
- Prioritise resilience by filtering for companies that score well on financial strength in the list of solid balance sheet and fundamentals (204 results).
This article by Simply Wall St is general in nature. We provide commentary based on historical data and analyst forecasts only using an unbiased methodology and our articles are not intended to be financial advice. It does not constitute a recommendation to buy or sell any stock, and does not take account of your objectives, or your financial situation. We aim to bring you long-term focused analysis driven by fundamental data. Note that our analysis may not factor in the latest price-sensitive company announcements or qualitative material. Simply Wall St has no position in any stocks mentioned.
Have feedback on this article? Concerned about the content? Get in touch with us directly. Alternatively, email editorial-team@simplywallst.com