


OVS (BIT:OVS) is back in focus after reporting half year earnings to July 31, 2026, with sales of €877.4 million and net income of €52.4 million, both above the prior period.
Recent price action has been supportive, with the OVS share price gaining 3.54% over the past week and contributing to a 23.86% year to date share price return. The 1 year total shareholder return of 46.27% also suggests momentum that has been building over several years.
Scan how OVS compares with other retailers showing strong momentum and fundamentals by running the curated 197 high quality undervalued stocks alongside this latest earnings move.
After a strong year for OVS and a share price not far from analyst targets, the real tension now lies in the gap between the current market quote and longer term value estimates.
Most Popular Narrative: 10.5% Undervalued
Against OVS’s last close at €5.99, the most widely followed narrative anchors fair value at €6.70. This frames the current momentum as slightly behind intrinsic estimates rather than stretched.
Analysts are assuming OVS's revenue will grow by 3.0% annually over the next 3 years. Analysts assume that profit margins will increase from 2.7% today to 5.5% in 3 years time.
See why 6 investors see OVS as 11% undervalued.
Result: Fair Value of €6.70 (UNDERVALUED)
Still, higher SG&A pressure and a heavier tax burden could limit how much of OVS’s recent operating progress ultimately reaches shareholders.
Find out about the key risks to this OVS narrative.
Another View on OVS: Cash Flows Point the Other Way
The SWS DCF model tells a very different story for OVS. On that assessment, the current share price near €6 sits above an estimated future cash flow value of €4.07, which frames the stock as overvalued rather than modestly undervalued. That split in signals forces a simple question: Which valuation do you trust more, the narrative on earnings or the one grounded in cash flows?
Look into how the SWS DCF model arrives at its fair value.
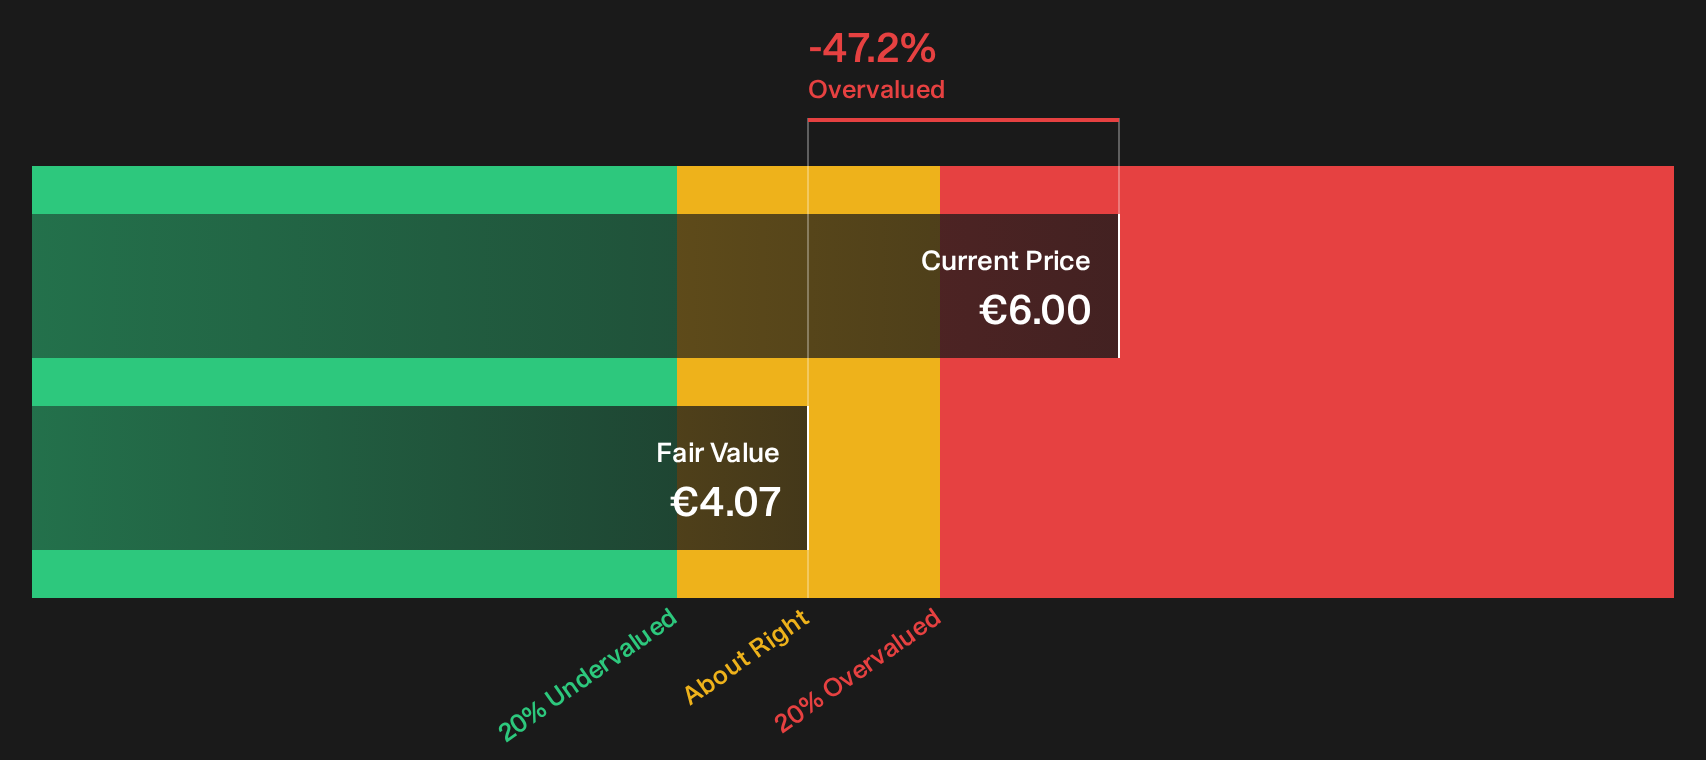
Simply Wall St performs a discounted cash flow (DCF) on every stock in the world every day (check out OVS for example). We show the entire calculation in full. You can track the result in your watchlist or portfolio and be alerted when this changes, or use our stock screener to discover 197 high quality undervalued stocks. If you save a screener we even alert you when new companies match - so you never miss a potential opportunity.
Next Steps
Mixed signals on OVS so far. If you want to move fast and build your own conviction, start by weighing the 4 key rewards and 2 important warning signs.
Looking for more OVS investment ideas?
If you are serious about stress testing your view on OVS, broaden your watchlist with a few focused stock shortlists built from hard numbers, not hype.
- Target potential mispricings by scanning companies that combine quality fundamentals with attractive valuations through the 197 high quality undervalued stocks.
- Prioritise resilience by checking businesses that carry sturdier balance sheets and solid fundamentals using the list of solid balance sheet and fundamentals (204 results).
- Hunt for under-the-radar opportunities by reviewing companies with strong financial profiles that the market has not fully noticed in the 619 high quality undiscovered gems.
This article by Simply Wall St is general in nature. We provide commentary based on historical data and analyst forecasts only using an unbiased methodology and our articles are not intended to be financial advice. It does not constitute a recommendation to buy or sell any stock, and does not take account of your objectives, or your financial situation. We aim to bring you long-term focused analysis driven by fundamental data. Note that our analysis may not factor in the latest price-sensitive company announcements or qualitative material. Simply Wall St has no position in any stocks mentioned.
Have feedback on this article? Concerned about the content? Get in touch with us directly. Alternatively, email editorial-team@simplywallst.com