


American Airlines Group has produced a mixed journey for shareholders, with a share price that has moved in different directions over shorter and longer time frames. That uneven path puts a spotlight on a simple question for anyone looking at the stock today: whether the current market value lines up with the sales the airline is generating.
- Over the past 5 years the stock has fallen 36.6%, which makes the current share price debate hinge even more on what its revenue base can justify.
- Recent moves such as the STARLUX codeshare agreement and American Airlines' role in long term sustainable aviation fuel supply may support future demand and influence how much investors are prepared to pay for each dollar of sales.
- The analysts covering American Airlines Group have run their own numbers. See what analysts think American Airlines Group's shares could be worth.
The issue now is whether American Airlines Group's current share price is appropriately aligned with its sales when compared with the Fair Ratio benchmark.
If you are weighing whether American Airlines Group's current price is justified by its sales, it can help to compare it with other companies screened for 32 high quality undervalued stocks
Does American Airlines Group Look Undervalued on Sales?
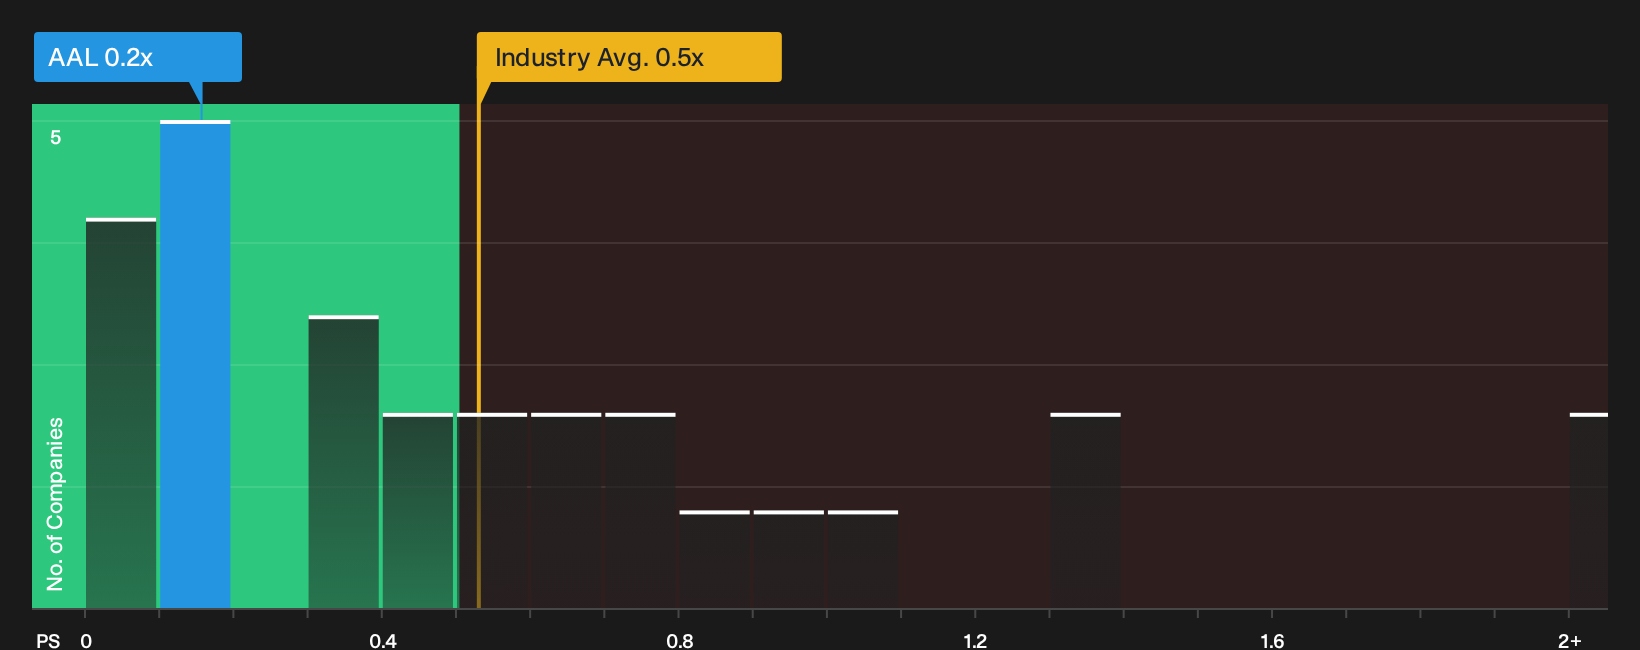
P/S works well for American Airlines Group because investors tend to focus on how much revenue each ticket and route can support against a given market value. On this measure, the stock trades on a P/S of about 0.2x, which is far below the Airlines industry average of roughly 0.5x and the peer group near 0.8x. That is a wide gap for a large carrier whose valuation is often anchored to the scale of its network and its ability to convert sales into cash.
Because the current multiple also sits below the Fair Ratio benchmark, which blends factors such as the firm’s margins, growth profile, risk and market size, the shares screen as undervalued on this framework. The recent capacity cuts in response to higher fuel costs mean management is prioritising profitability over pure volume, and despite that cautious stance the market is still pricing American Airlines Group at a discount to what its sales base might suggest. Explore the numbers behind American Airlines Group's P/S valuation.
The American Airlines Group Narrative: What Would Justify Today's Price?
Simply Wall St Narratives for American Airlines Group pick up where the valuation puzzle leaves off by spelling out which paths for growth, profitability and earnings would need to play out for the stock to be worth materially more or less than today’s price on the Community page. Each scenario pins its number to a clear view on how American Airlines Group's revenue mix, cost base and risk profile could evolve, giving you something specific to revisit as new information emerges.
Community views on American Airlines Group split around what matters more right now: fuel and debt pressure versus loyalty and premium demand.
Bull case: 23% undervalued
"The significant growth in engaged AAdvantage loyalty program members and the new 10-year Citi card agreement, launching in 2026, provide structural tailwinds…"
Discover why this Narrative puts American Airlines Group at 23% undervalued.
Bear case: 36% overvalued
"Substantial capital expenditures will persist for fleet modernization, as American's delivery schedule for new aircraft remains high for the rest of the decade…"
Explore why this Narrative puts American Airlines Group at 36% overvalued.
One more piece of the American Airlines Group puzzle to check
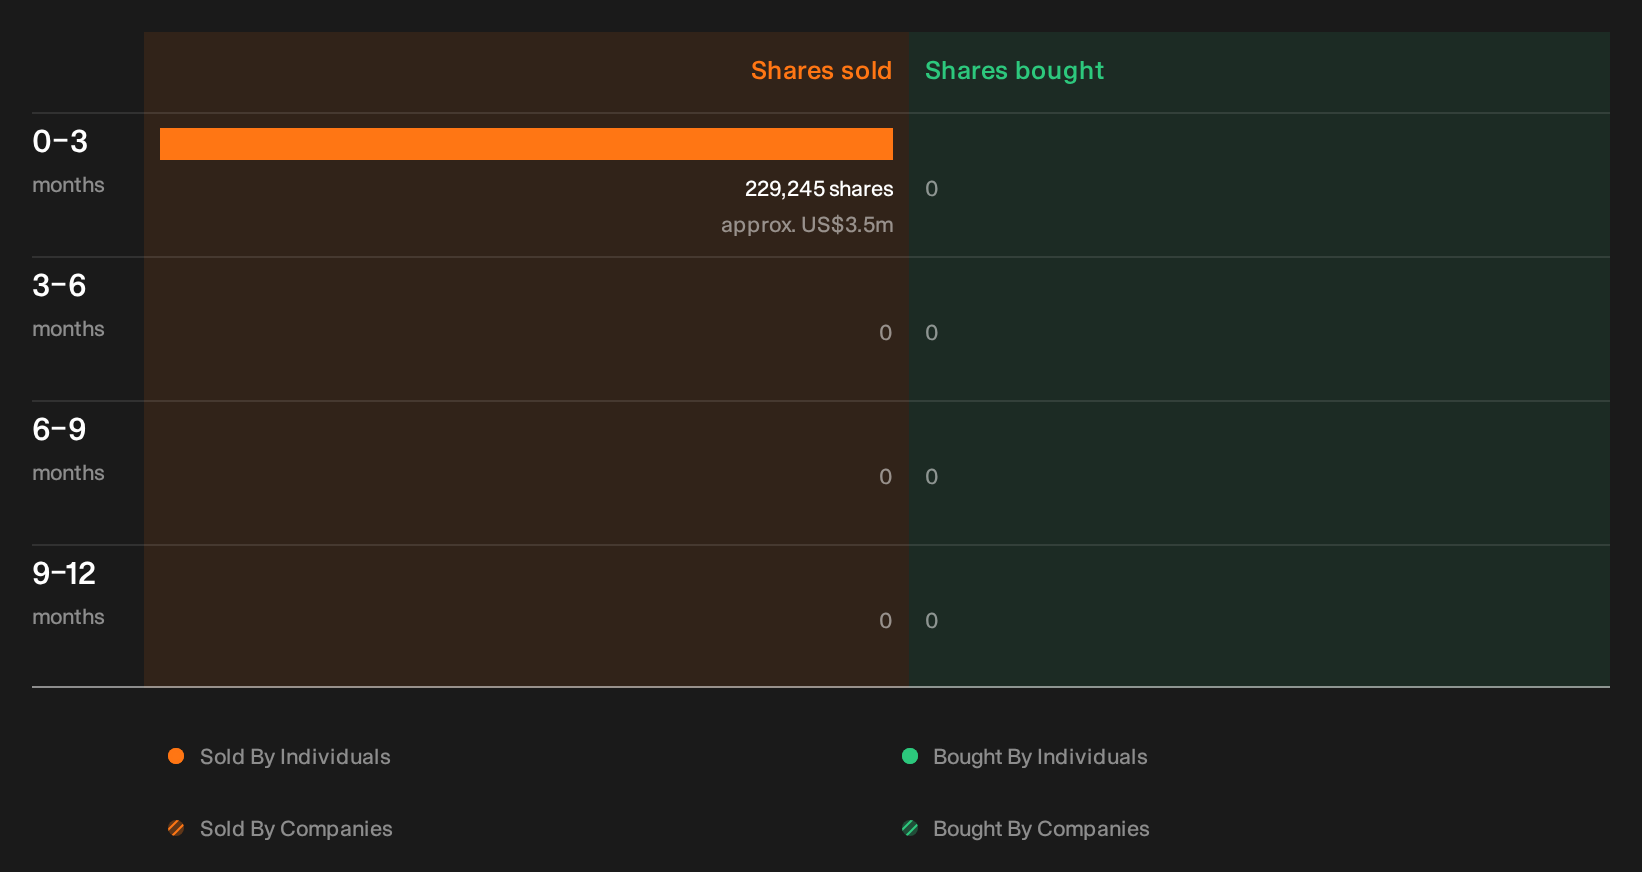
Before you lean too much on the current valuation story for American Airlines Group, it helps to look at what recent insider share sales might signal about confidence inside the business. See the recent insider selling flagged for American Airlines Group.
This article by Simply Wall St is general in nature. We provide commentary based on historical data and analyst forecasts only using an unbiased methodology and our articles are not intended to be financial advice. It does not constitute a recommendation to buy or sell any stock, and does not take account of your objectives, or your financial situation. We aim to bring you long-term focused analysis driven by fundamental data. Note that our analysis may not factor in the latest price-sensitive company announcements or qualitative material. Simply Wall St has no position in any stocks mentioned.
Have feedback on this article? Concerned about the content? Get in touch with us directly. Alternatively, email editorial-team@simplywallst.com