


Texas Instruments (TXN) just moved its shareholder payout higher, approving a 7% increase in the quarterly dividend to $1.52 per share and extending its 23-year streak of annual raises.
The dividend move comes as the stock has already seen a strong re-rating this year, with Texas Instruments posting a year-to-date share price return of 57.78% and a 1-year total shareholder return of 59.29%. Short-term momentum has cooled slightly, with a 7.35% 1-month share price gain followed by a 4.43% retreat over the past 90 days.
Compare Texas Instruments' latest dividend move and valuation debate with a hand-picked 31 high quality undervalued stocks that may offer a different balance of income, price and risk.
Texas Instruments now trades near where recent enthusiasm intersects with a discounted cash flow model that points lower. With analyst targets still above today’s price, the key question is where fair value realistically sits within that spread.
Most Popular Narrative: 36% Undervalued
Texas Instruments last closed at $280.09 while the most followed valuation storyline pegs fair value closer to $435.69. This frames the current debate in terms of how much of that gap investors believe is truly achievable.
Texas Instruments is in the midst of a multiyear capacity-expansion cycle that is temporarily suppressing free cash flow but materially enhancing the company’s long-term competitive position. The buildout of U.S.-based 300mm analog manufacturing is expected to structurally improve cost efficiency, support higher gross margins, and increase supply-chain resilience. As these assets ramp and utilization normalizes, TXN should regain its historical free-cash-flow profile, supported by diversified end-market exposure across industrial, automotive, aerospace/defense, and energy infrastructure.
See why 20 investors see Texas Instruments as 36% undervalued.
According to niteco, who authored this widely followed narrative, Texas Instruments screens as undervalued by about 36% when comparing that $435.69 fair value estimate to the current share price. This is based on an 11% revenue growth rate, a 42% profit margin and a 9% discount rate in the underlying model.
Result: Fair Value of $435.69 (UNDERVALUED)
Still, the Texas Instruments thesis leans heavily on long-lived fabs and AI-linked demand. As a result, weaker utilization or slower automation and electrification spending could quickly challenge that optimism.
Find out about the key risks to this Texas Instruments narrative.
Another View on Texas Instruments Valuation
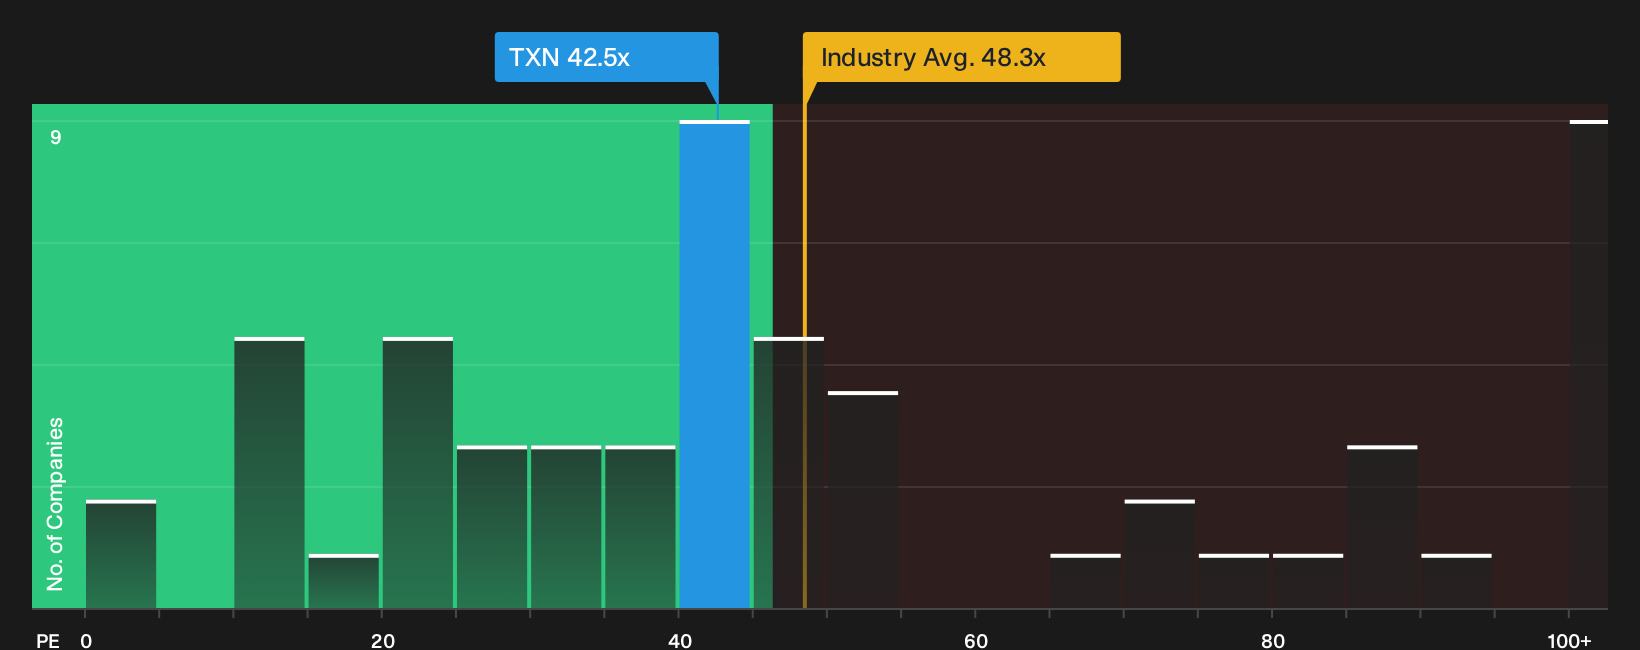
There is also a simple earnings multiple check that pulls against that 36% undervalued story for Texas Instruments. The stock trades on a P/E of 42.5x, which looks cheaper than semiconductor peers at 48.3x, but richer than its own fair ratio of 34x.
That gap suggests the market already bakes in a solid future and might still move closer to that 34x fair ratio if expectations cool. For anyone weighing fresh money today, the question is which anchor feels more realistic: the peer premium or the fair ratio pull.
See what the numbers say about this price — find out in our valuation breakdown.
Simply Wall St performs a discounted cash flow (DCF) on every stock in the world every day (check out Texas Instruments for example). We show the entire calculation in full. You can track the result in your watchlist or portfolio and be alerted when this changes, or use our stock screener to discover 31 high quality undervalued stocks. If you save a screener we even alert you when new companies match - so you never miss a potential opportunity.
Next Steps
Mixed messages on Texas Instruments valuation and income story can tempt you to lean on headlines, but the faster move is to interrogate the full picture and weigh both caution and optimism for yourself. To see both sides set out clearly, review the 2 key rewards and 2 important warning signs
Looking for more investment ideas beyond Texas Instruments?
If this Texas Instruments story has you thinking harder about price, quality and risk, do not stop here. The next move could be finding a better fit.
- Target resilient balance sheets and steady fundamentals by scanning a focused list of solid balance sheet and fundamentals (25 results) that keeps financial strength front and center.
- Spot potential mispricing quickly by reviewing a curated 31 high quality undervalued stocks that combines quality metrics with valuation checks in one place.
- Hunt for overlooked opportunities by walking through a 19 high quality undiscovered gems where strong businesses have yet to attract broad attention.
This article by Simply Wall St is general in nature. We provide commentary based on historical data and analyst forecasts only using an unbiased methodology and our articles are not intended to be financial advice. It does not constitute a recommendation to buy or sell any stock, and does not take account of your objectives, or your financial situation. We aim to bring you long-term focused analysis driven by fundamental data. Note that our analysis may not factor in the latest price-sensitive company announcements or qualitative material. Simply Wall St has no position in any stocks mentioned.
Have feedback on this article? Concerned about the content? Get in touch with us directly. Alternatively, email editorial-team@simplywallst.com