


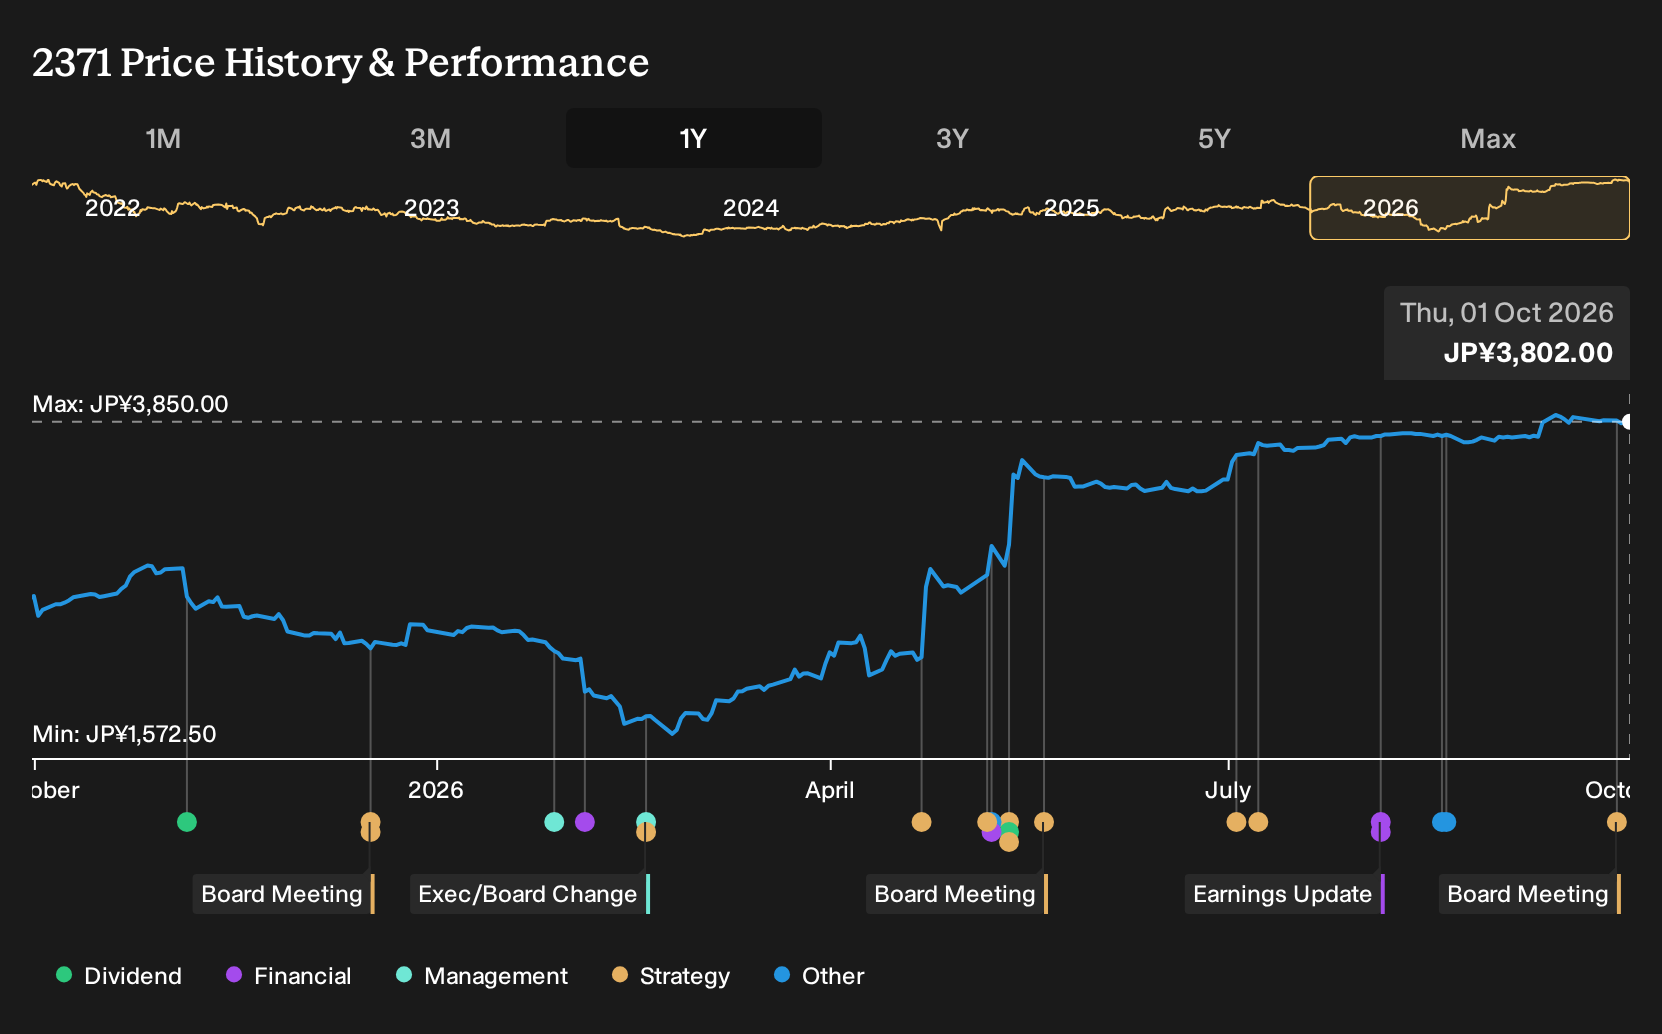
- Kakaku.com held a board meeting on 28 September 2026 to consider dissolving its capital alliance with KDDI CORPORATION while keeping the existing business alliance in place and reassessing which entities qualify as other affiliated companies.
- Removing KDDI from the shareholder structure while preserving commercial ties could reshape how investors view Kakaku.com's control, capital flexibility, and longer term partnership dependence.
- The focus now is on how dissolving the capital alliance with KDDI while keeping the commercial partnership affects Kakaku.com's investment narrative.
Scan how Kakaku.com's move away from KDDI as a shareholder compares with other firms reshaping their investor base by reviewing the hand picked list of solid balance sheet and fundamentals (23 results) for potential alternatives.
What Is Kakaku.com's Investment Narrative?
Kakaku.com appeals to investors who believe its price comparison, restaurant reviews and job platforms can keep pulling users and advertisers at scale. The group showed revenue of ¥97,869 and net income of ¥18,486, with high return on equity of 28.5% and earnings seen growing, even if not at very high rates. Capital needs are modest for a digital operator, so execution is more about product relevance and merchandising than heavy spending on physical assets.
The move to dissolve the capital alliance with KDDI while keeping the business partnership looks more about capital flexibility and governance optics than day to day operations. In the near term, the bigger swing factors stay the same: user engagement across Kakaku.com and Tabelog, pricing power with advertisers and how the market treats a P/E of 40.7x when analyst targets sit lower.
Yet the story around this premium valuation only really comes into focus once you weigh one uncomfortable detail that sits in plain sight...
There's only one way to know the right time to buy, sell or hold Kakaku.com. Head to Simply Wall St's company report for the latest analysis of Kakaku.com's Fair Value.
Exploring Other Perspectives
One alternate view is that Kakaku.com’s heavy investment year could squeeze profitability more than consensus expects. The most pessimistic analysts were modelling revenue of about ¥131.0b and earnings of ¥26.8b by around February 2029, with margins easing. The board move on KDDI could easily push those forecasts, and your own view, in either direction.
Explore another Kakaku.com fair value estimate, including one that suggests as much as 45% downside from the current price.
The Verdict Is Yours
Disagree with this assessment? Extraordinary investment returns rarely come from following the herd, so go with your instincts.
- A great starting point for your Kakaku.com research is our analysis highlighting 1 key reward that could impact your investment decision.
- See our latest analysis for Kakaku.com. The report includes a comprehensive fundamental analysis summarized in a single visual, the Snowflake, making it easy to evaluate Kakaku.com's overall financial health at a glance.
Looking For More Investment Ideas Beyond Kakaku.com?
If this shift in Kakaku.com's shareholding has you rethinking concentration risk, it can help to compare it against a wider set of businesses with different balance sheets, income profiles and payout habits. The Simply Wall St Screener provides a way to filter for features that matter to you and then review those candidates side by side.
- For investors who care most about robust finances and low refinancing pressure, start with a curated list of solid balance sheet and fundamentals (23 results) that focuses on resilient balance sheets and cleaner fundamentals.
- If value is your primary focus and you want ideas where quality metrics and pricing both look appealing, use the 17 high quality undervalued stocks to see which companies currently align with that profile.
- Income focused portfolios can draw on a shortlist that combines higher yields with sturdier business models, so consider reviewing the 20 dividend fortresses to identify potential candidates for further research.
This article by Simply Wall St is general in nature. We provide commentary based on historical data and analyst forecasts only using an unbiased methodology and our articles are not intended to be financial advice. It does not constitute a recommendation to buy or sell any stock, and does not take account of your objectives, or your financial situation. We aim to bring you long-term focused analysis driven by fundamental data. Note that our analysis may not factor in the latest price-sensitive company announcements or qualitative material. Simply Wall St has no position in any stocks mentioned.
Have feedback on this article? Concerned about the content? Get in touch with us directly. Alternatively, email editorial-team@simplywallst.com