


Hulic has delivered a powerful run over the past few years, which puts fresh attention on what investors are really paying for its earnings today. With the stock recently closing at ¥1,726, the question now is whether that price still lines up with the underlying profit engine of the business.
- Hulic has returned 85.9% over the past 5 years, which raises the stakes on whether its current earnings profile can support that step up in market value.
- The group’s real estate focused business model tends to lean heavily on the durability of rental income and asset values, so expectations for future profit margins and cash conversion matter a lot when judging what a fair P/E could be.
- Your read on Hulic is one view; the desks covering it have another. See what analysts think Hulic's shares could be worth.
For investors, the debate is whether Hulic’s present share price is adequately supported by the earnings it generates today.
If you want a broader starting point while you assess whether Hulic’s earnings justify its current price, you can run the same test across 17 high quality undervalued stocks.
Is Hulic Still Cheap on Earnings?
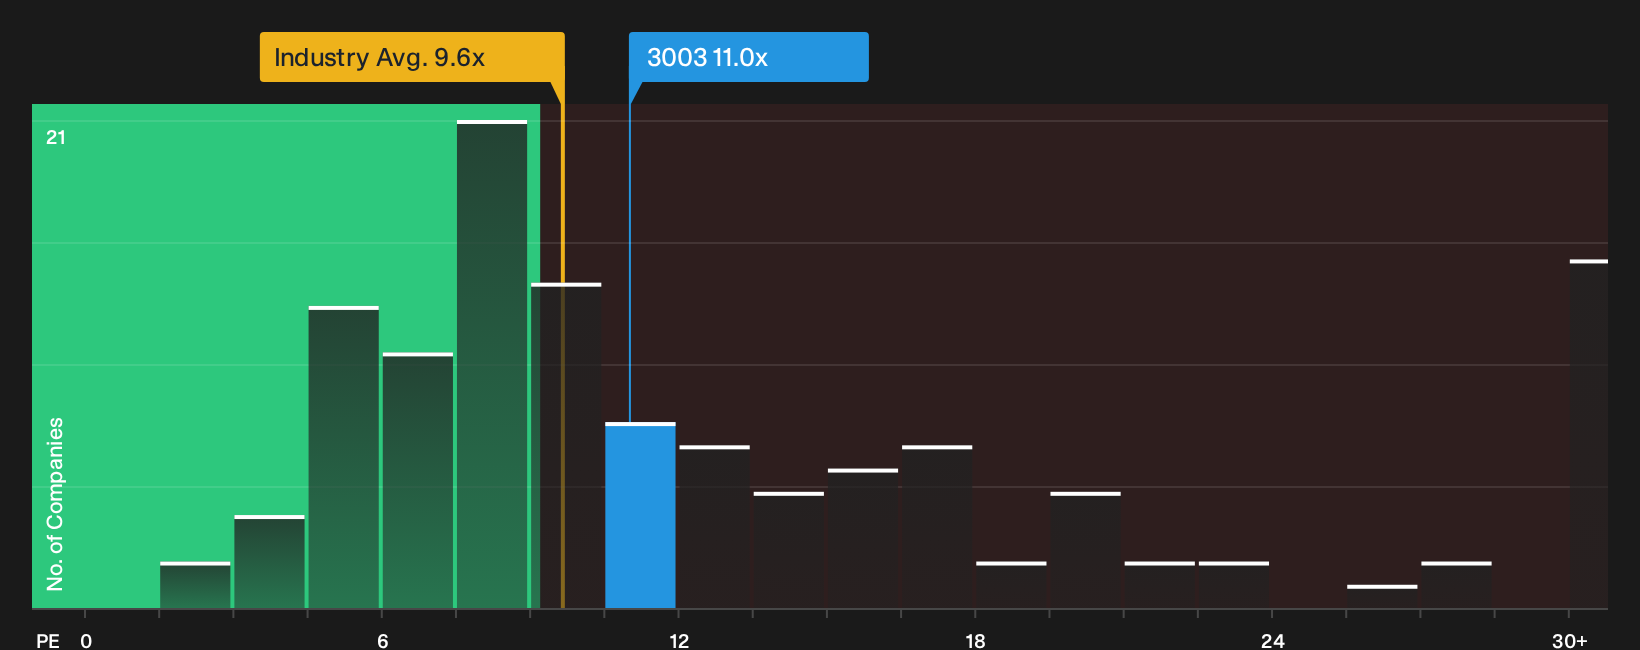
The P/E ratio suits Hulic because earnings are a key yardstick for a real estate operator with an income focused portfolio. At roughly 11.0x earnings, Hulic trades below the broader Real Estate industry average of about 9.6x, yet also at a clear discount to the roughly 18.8x level seen across its peer group.
The tailored fair-value framework, which adjusts for Hulic’s specific growth profile, margins, scale and risks, points to a higher P/E than where the shares change hands today. That places the current multiple in undervalued territory on this measure, even after the strong share price run, and leaves room for investors to question whether the market is fully recognising the earnings power already visible in the reported numbers. Explore the numbers behind Hulic's P/E valuation.
The Hulic Narrative: What Would Justify Today's Price?
Simply Wall St Narratives pick up where the Hulic valuation puzzle leaves off. They explain which combinations of growth, margins and earnings would need to occur for Hulic to be worth materially more or less than today’s price. Each scenario links a fair value to a specific mix of potential catalysts and risks, so you can watch over time which version of events appears to be unfolding on the Community page.
A clear, number driven narrative on Hulic gives you a reference point for what earnings, margins and execution would need to look like to make today’s P/E feel justified. It also creates a framework you can revisit as new results arrive, so shifts in Hulic’s profit profile can be compared directly with the original assumptions.
Share your own Narrative for Hulic and set out the assumptions behind your valuation.
Before you act on Hulic's valuation, there is one more angle to check
Price and earnings only tell part of the story for Hulic, because our broader review has surfaced specific concerns that deserve a closer look before you lean on the numbers alone. Take a closer look at 2 warning signs (1 major) before settling on a valuation.
This article by Simply Wall St is general in nature. We provide commentary based on historical data and analyst forecasts only using an unbiased methodology and our articles are not intended to be financial advice. It does not constitute a recommendation to buy or sell any stock, and does not take account of your objectives, or your financial situation. We aim to bring you long-term focused analysis driven by fundamental data. Note that our analysis may not factor in the latest price-sensitive company announcements or qualitative material. Simply Wall St has no position in any stocks mentioned.
Have feedback on this article? Concerned about the content? Get in touch with us directly. Alternatively, email editorial-team@simplywallst.com