


Nippon Shinyaku (TSE:4516) was removed from the FTSE All-World Index (USD) on 19 September 2026, an event that can trigger forced trades as passive funds rebalance and reassess exposure.
Over the past year, Nippon Shinyaku has combined a 1-year total shareholder return of 9.37% with a sharp year to date share price decline of 36.81%. That weaker recent momentum, including a 15.12% fall over 90 days, helps frame the index removal as part of a broader cooling in sentiment rather than a sudden break in the story.
See how Nippon Shinyaku compares to other potential rebound or re-rating candidates using our curated list of 17 high quality undervalued stocks.
Nippon Shinyaku’s removal from the index and the sharp share price slide leave a tight gap between market price and analyst targets. Does fair value really cluster here, or do other estimates point elsewhere?
Price-to-Earnings of 7.5x: Is it justified?
Nippon Shinyaku now trades on a P/E of 7.5x, which sits well below both the wider JP market on 13.9x and the JP Pharmaceuticals industry on 14.1x. That gap indicates the market is pricing the shares more cautiously than peers despite a long history on the exchange and a ¥3,497 last close.
The P/E ratio compares Nippon Shinyaku's current share price to its earnings per share. For a pharmaceutical group with ¥157,577 in Pharmaceuticals revenue and ¥31,559 in net income, this multiple is a quick shorthand for how much investors are willing to pay for each unit of profit today.
On the numbers provided, the stock is described as trading at "good value" versus peers on 16x and also versus the broader JP market. The estimated fair P/E of 7.6x sits very close to the current 7.5x, which suggests the market is already near the level that regression-based analysis indicates it could move towards rather than implying an extreme mispricing.
Compared with the JP Pharmaceuticals average on 14.1x, Nippon Shinyaku carries a far lower earnings multiple, which is a strong relative discount. That is tempered by forecasts that point to earnings and revenue declining over the next 3 years, so the lower P/E can be read as the market assigning a more cautious outlook rather than paying up for future growth.
Explore the SWS fair ratio for Nippon Shinyaku.
Result: Price-to-Earnings of 7.5x (UNDERVALUED)
Still, the annual declines in revenue and net income, together with the long 3 year and 5 year total return drawdowns, can easily keep skepticism in play.
Find out about the key risks to this Nippon Shinyaku narrative.
Another view on Nippon Shinyaku’s value
On a simple earnings multiple, Nippon Shinyaku looks cheap. The SWS DCF model tells a different story. At ¥3,497, the shares sit above an estimated future cash flow value of ¥2,034.31, which points to the stock screening as overvalued on this measure and raises the question of which lens you should trust more.
Look into how the SWS DCF model arrives at its fair value.
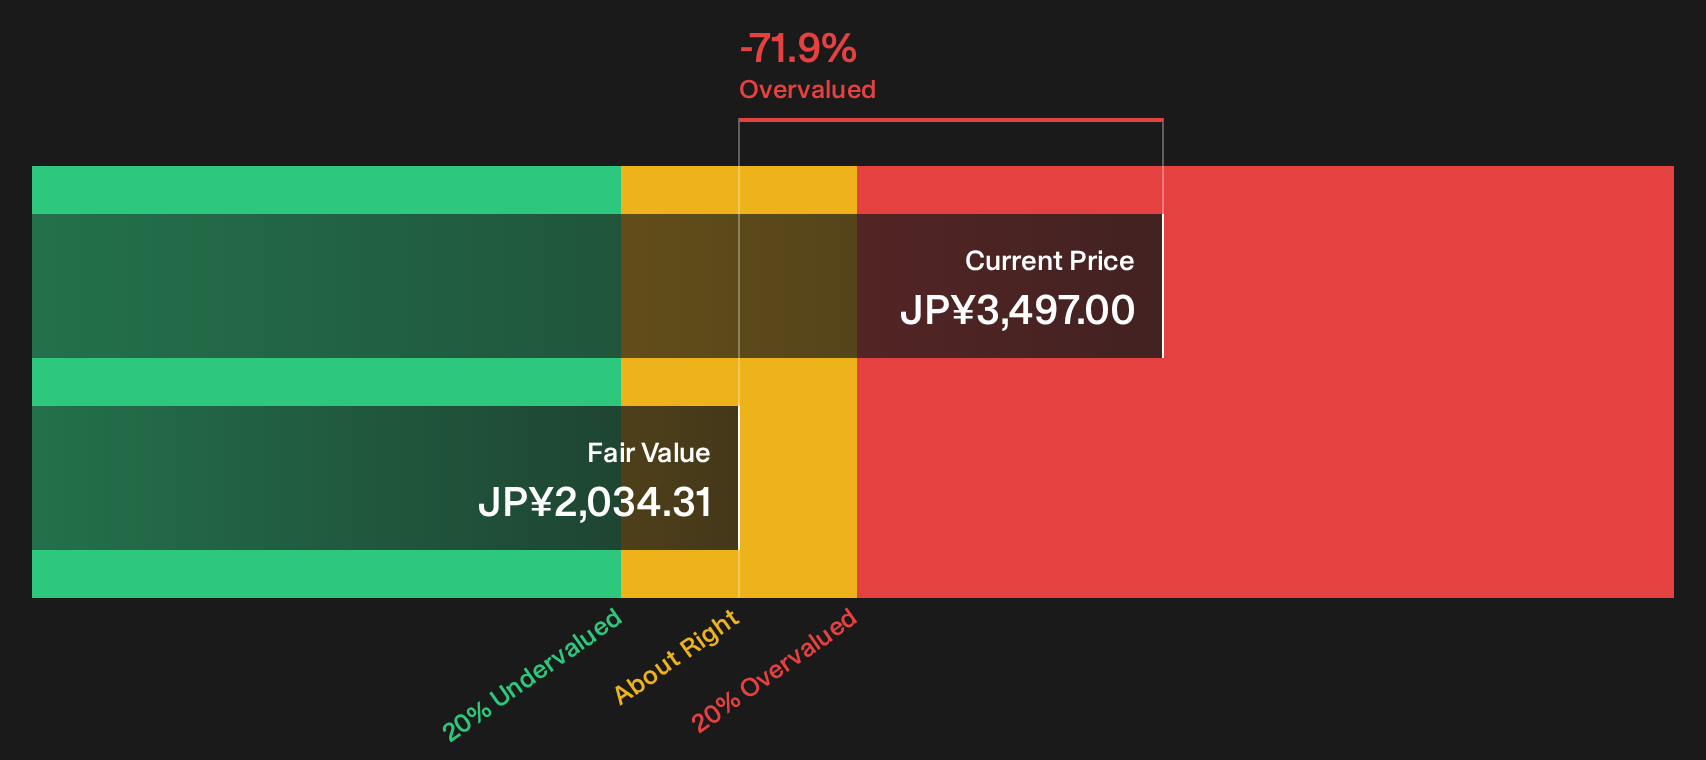
Simply Wall St performs a discounted cash flow (DCF) on every stock in the world every day (check out Nippon Shinyaku for example). We show the entire calculation in full. You can track the result in your watchlist or portfolio and be alerted when this changes, or use our stock screener to discover 17 high quality undervalued stocks. If you save a screener we even alert you when new companies match - so you never miss a potential opportunity.
Next Steps
Sentiment around Nippon Shinyaku is clearly mixed, which is exactly why it pays to look past the headlines and review the numbers directly. To weigh both the concerns and the potential upside side by side, review the 4 key rewards and 1 important warning sign.
Looking for more investment ideas beyond Nippon Shinyaku?
If fresh ideas matter to you, do not stop at Nippon Shinyaku. Use different filters, compare outcomes and let the data surface what you might otherwise miss.
- Target dependable cash generators by reviewing companies in the list of solid balance sheet and fundamentals (23 results) that pair sturdy finances with cleaner balance sheets.
- Hunt for potential mispricings by scanning the 76 high quality undiscovered gems that combine quality fundamentals with relatively low market attention.
- Prioritise resilience by focusing on the 21 resilient stocks with low risk scores that flag businesses with lower risk scores and steadier profiles.
This article by Simply Wall St is general in nature. We provide commentary based on historical data and analyst forecasts only using an unbiased methodology and our articles are not intended to be financial advice. It does not constitute a recommendation to buy or sell any stock, and does not take account of your objectives, or your financial situation. We aim to bring you long-term focused analysis driven by fundamental data. Note that our analysis may not factor in the latest price-sensitive company announcements or qualitative material. Simply Wall St has no position in any stocks mentioned.
Have feedback on this article? Concerned about the content? Get in touch with us directly. Alternatively, email editorial-team@simplywallst.com