


Open Text shares have retreated sharply over the past few years, which naturally raises the question of whether the current valuation is still in step with the earnings the software group is generating today. With the stock under pressure and fresh financing moves reshaping its balance sheet, the key issue for you is how much of the business's profit stream the current share price is actually asking you to pay for.
- The share price has fallen 45.8% over the past 5 years. This puts the spotlight firmly on whether the current market value is still aligned with the company’s earnings power.
- Management’s decision to issue US$1b of new senior secured notes and refinance nearer term debt may influence interest costs and cash flow timing. This feeds directly into how investors think about the sustainability of earnings.
- There is a second opinion on Open Text worth weighing. See what analysts think Open Text's shares could be worth.
The issue now is whether Open Text's current share price is justified by the earnings it produces after this period of weaker returns and balance sheet reshaping.
If you want to see how this same earnings question looks across a wider set of companies, take a look at 31 high quality undervalued stocks.
Is Open Text Still Cheap on Earnings?
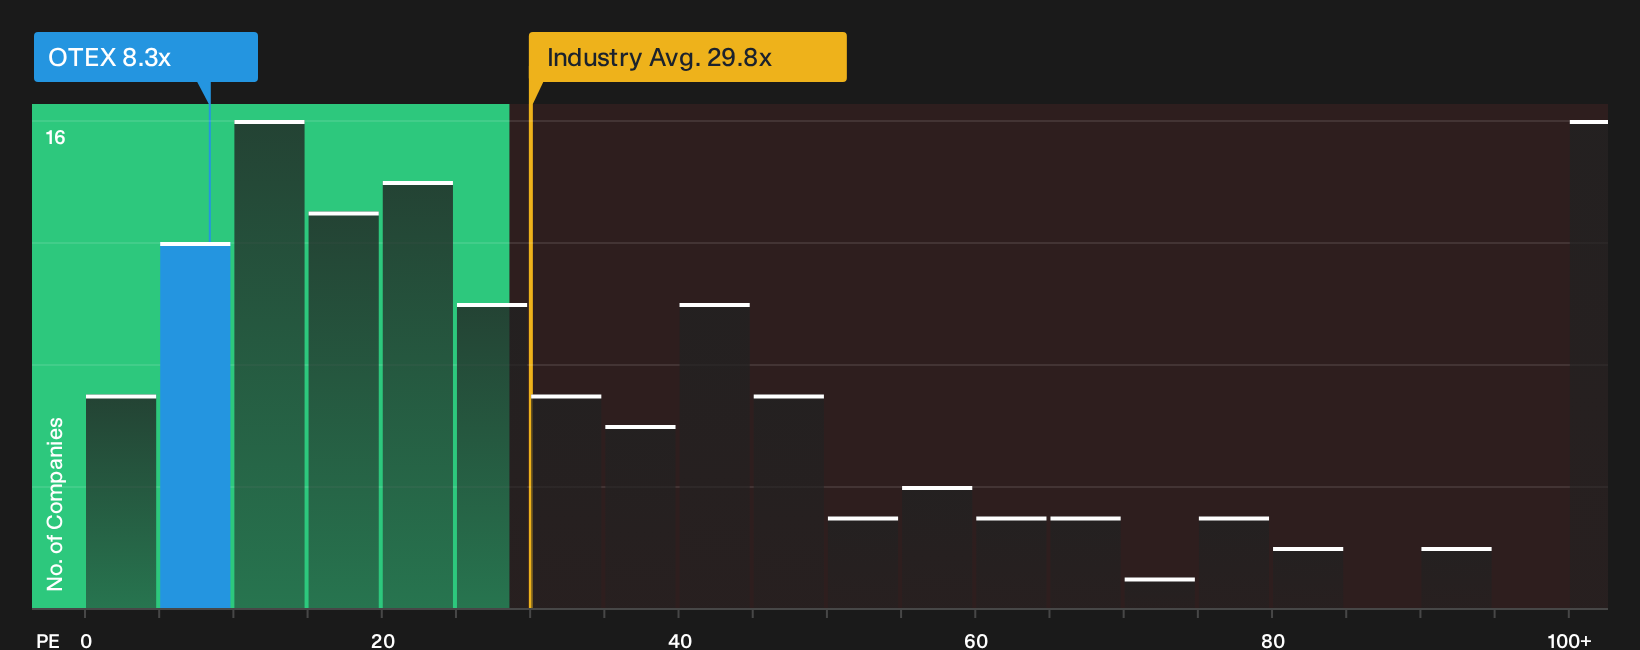
The P/E ratio fits Open Text because earnings are a key anchor for a mature software group with an established cash flow base. On this yardstick, Open Text trades on a P/E of 8.3x, compared with a Software industry average of 29.8x and a peer group average of 28.0x. That is a steep gap between what investors are currently paying for each dollar of Open Text earnings and what they pay for profits at many other listed software businesses.
Because the recent refinancing has pushed out debt maturities and clarified interest costs, the market has better visibility on how much of those earnings may flow through to equity holders. Yet the multiple still screens well below the level suggested by a tailored fair P/E that accounts for the firm’s size, margins and risk profile. This points to Open Text screening as undervalued on earnings against that customised yardstick, which is a useful lens if you are weighing whether the low headline multiple reflects hesitation about future profitability or simply a discount that has not closed yet. Explore the numbers behind Open Text's P/E valuation.
The Open Text Narrative: What Would Justify Today's Price?
Simply Wall St Narratives for Open Text pick up where the P/E puzzle leaves off and explain what growth, profitability and earnings path would need to occur for the shares to appear meaningfully higher or lower than today’s price. Each narrative links a fair value estimate to a clear storyline about Open Text's potential catalysts and risks so you can track over time which version of events seems closest to reality on the Community page.
One of the top community narratives on Open Text: 20% undervalued
"The main thing that has to go right is that Open Text successfully executes its cloud and AI upsell strategy while rebuilding its go to market engine and managing the drag from legacy on premise revenues…"
Discover why this Narrative puts Open Text at 20% undervalued.
For Open Text, who is steering the ship matters as much as the sticker price
Before you focus only on what you pay for Open Text earnings, it helps to know who is making the key decisions and how their pay packets line up with your interests. See who runs Open Text and how they are paid.
This article by Simply Wall St is general in nature. We provide commentary based on historical data and analyst forecasts only using an unbiased methodology and our articles are not intended to be financial advice. It does not constitute a recommendation to buy or sell any stock, and does not take account of your objectives, or your financial situation. We aim to bring you long-term focused analysis driven by fundamental data. Note that our analysis may not factor in the latest price-sensitive company announcements or qualitative material. Simply Wall St has no position in any stocks mentioned.
Have feedback on this article? Concerned about the content? Get in touch with us directly. Alternatively, email editorial-team@simplywallst.com